
Grim Western snowpack update
Plus, SnowSlang: N is for "nor'easter"

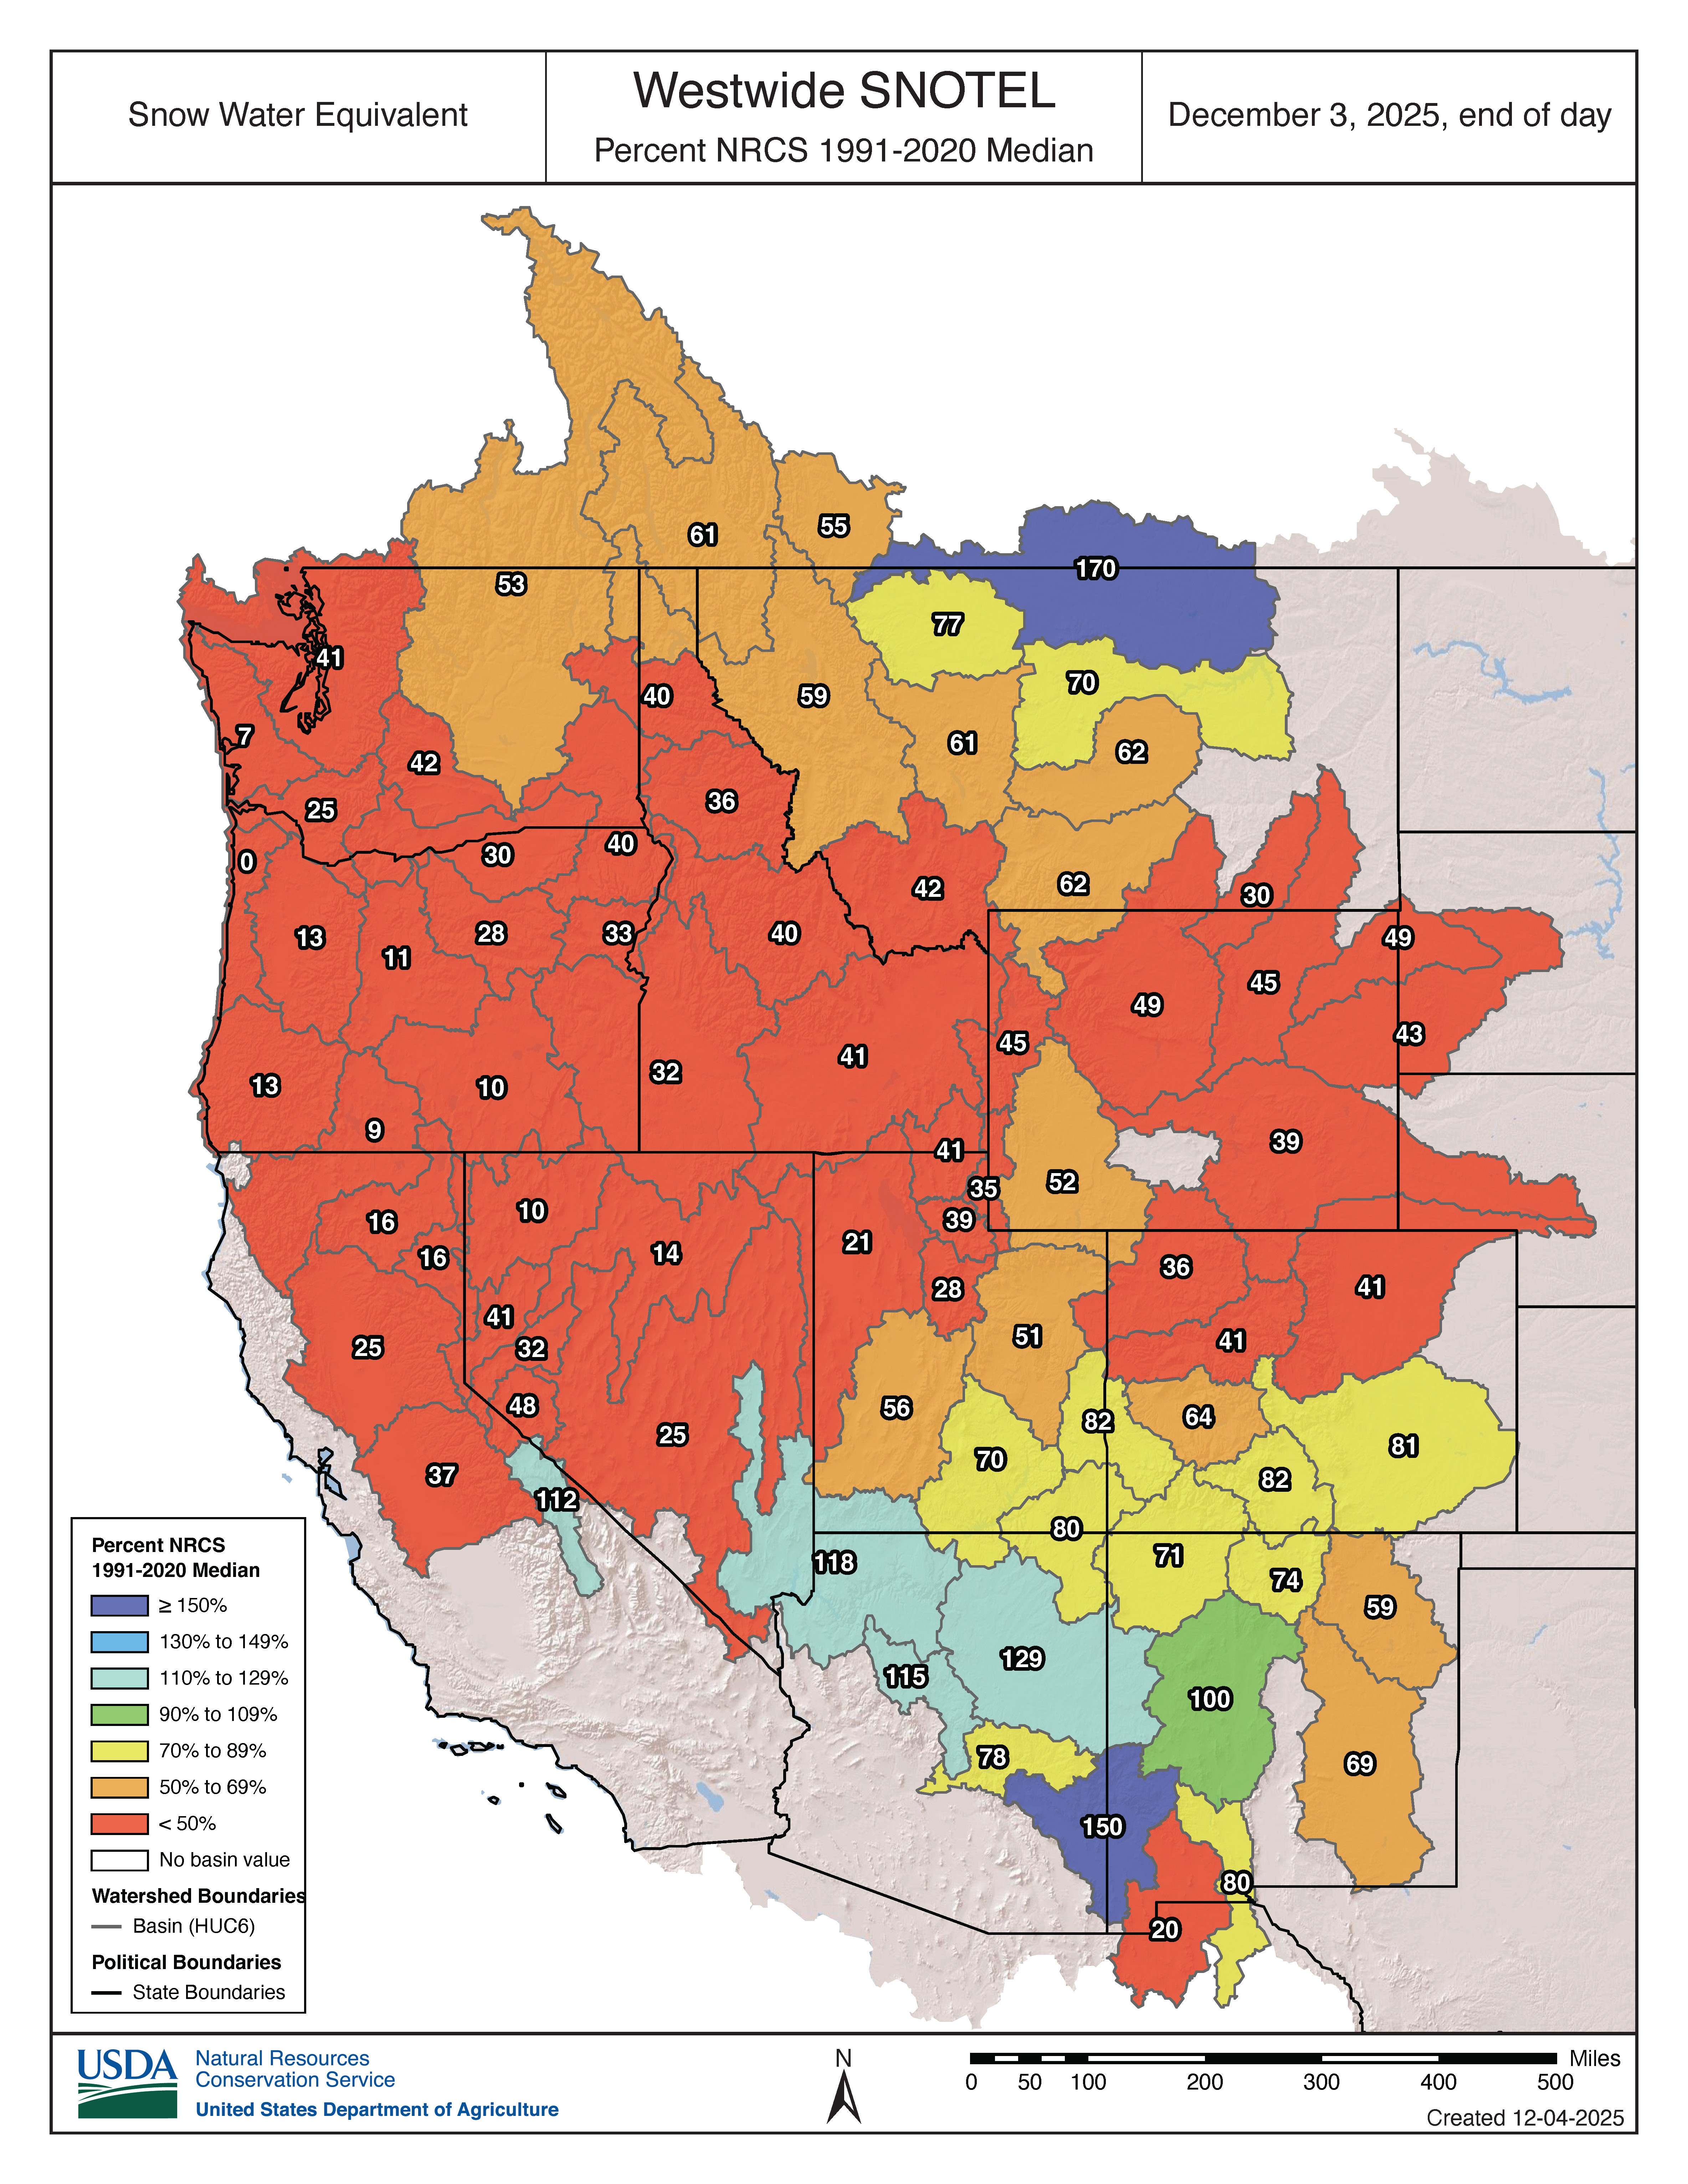
The American West sure could use some snow.
We’re just over two months into the water year, which began October 1, so there’s plenty of time to catch up. But it’s been a dismal start for the snowpack across nearly the entire region.
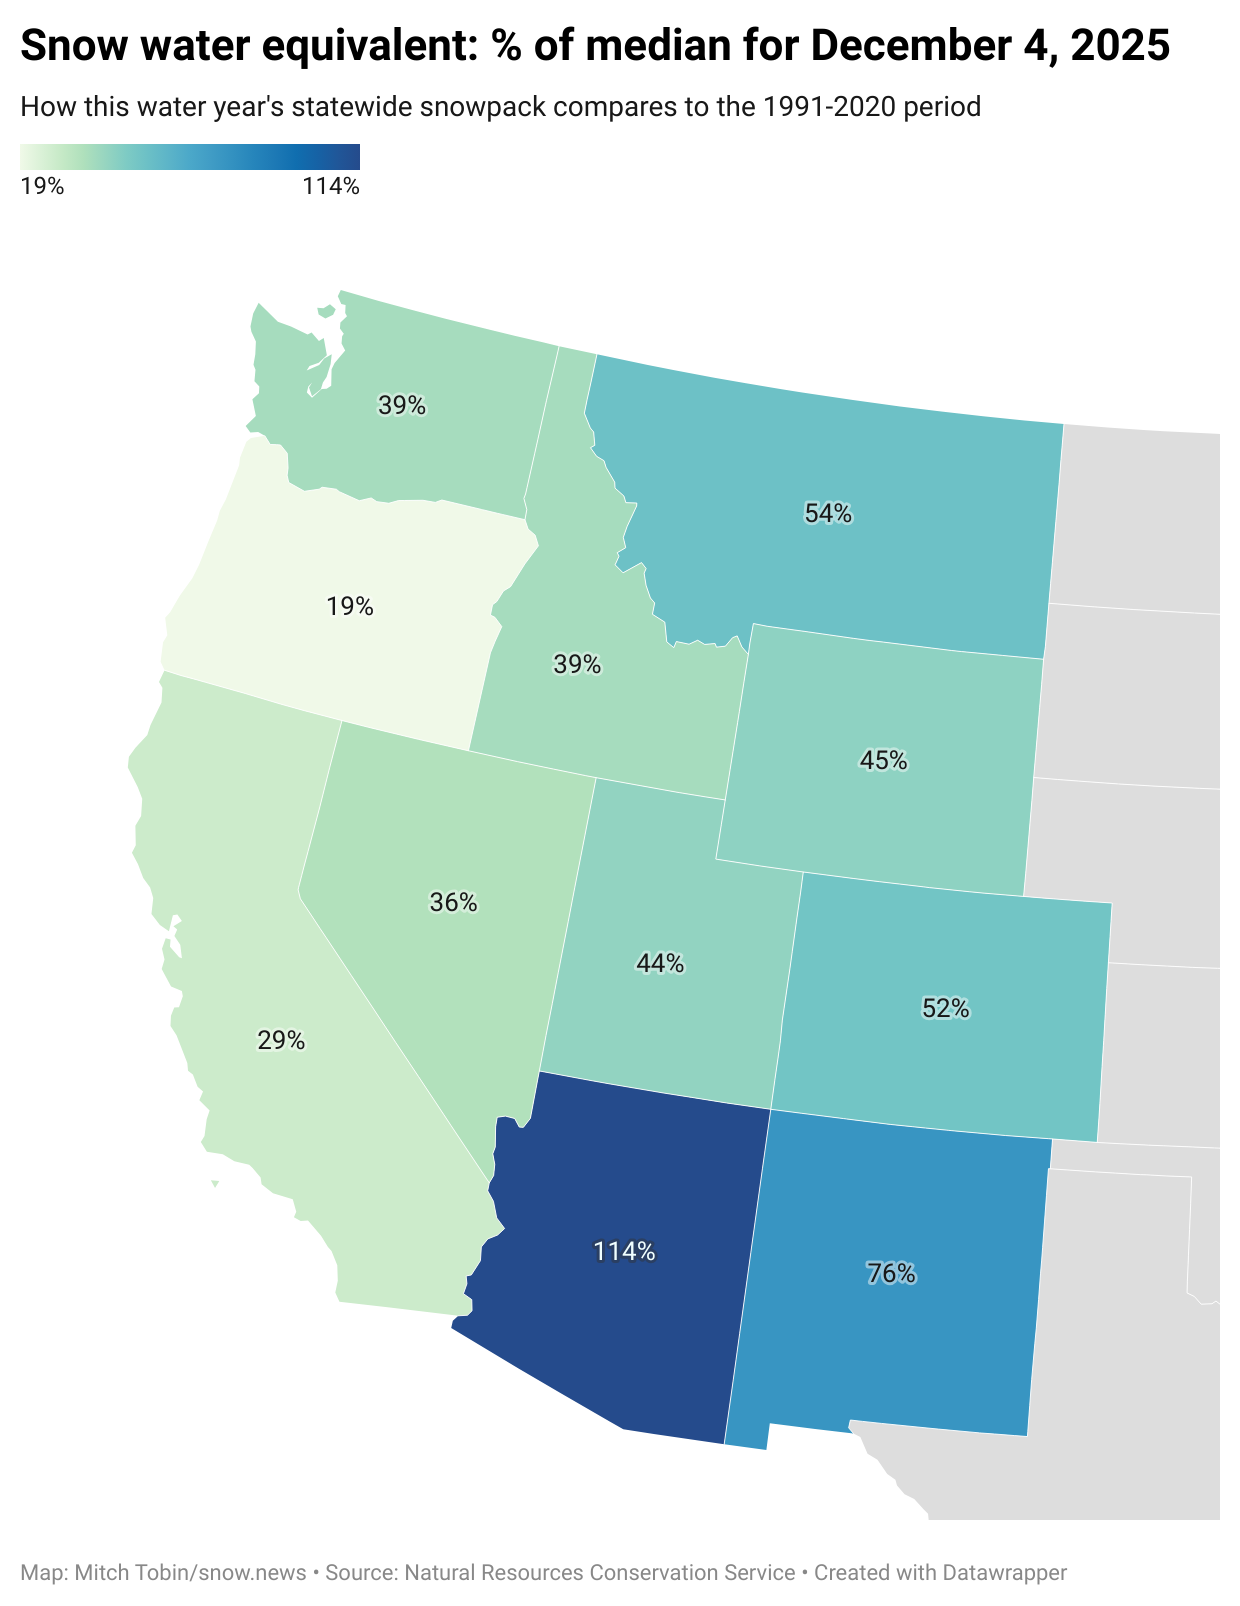
As shown in the map above, only Arizona had a statewide snowpack above the long-term median on December 4, while seven of the 11 contiguous Western states had readings below 50% of normal.
It’s a different story for overall precipitation, which includes both rain and snow. The map below shows that all Western states except Oregon were near or above the 30-year median for precipitation, with Arizona at nearly double the normal level since October 1.
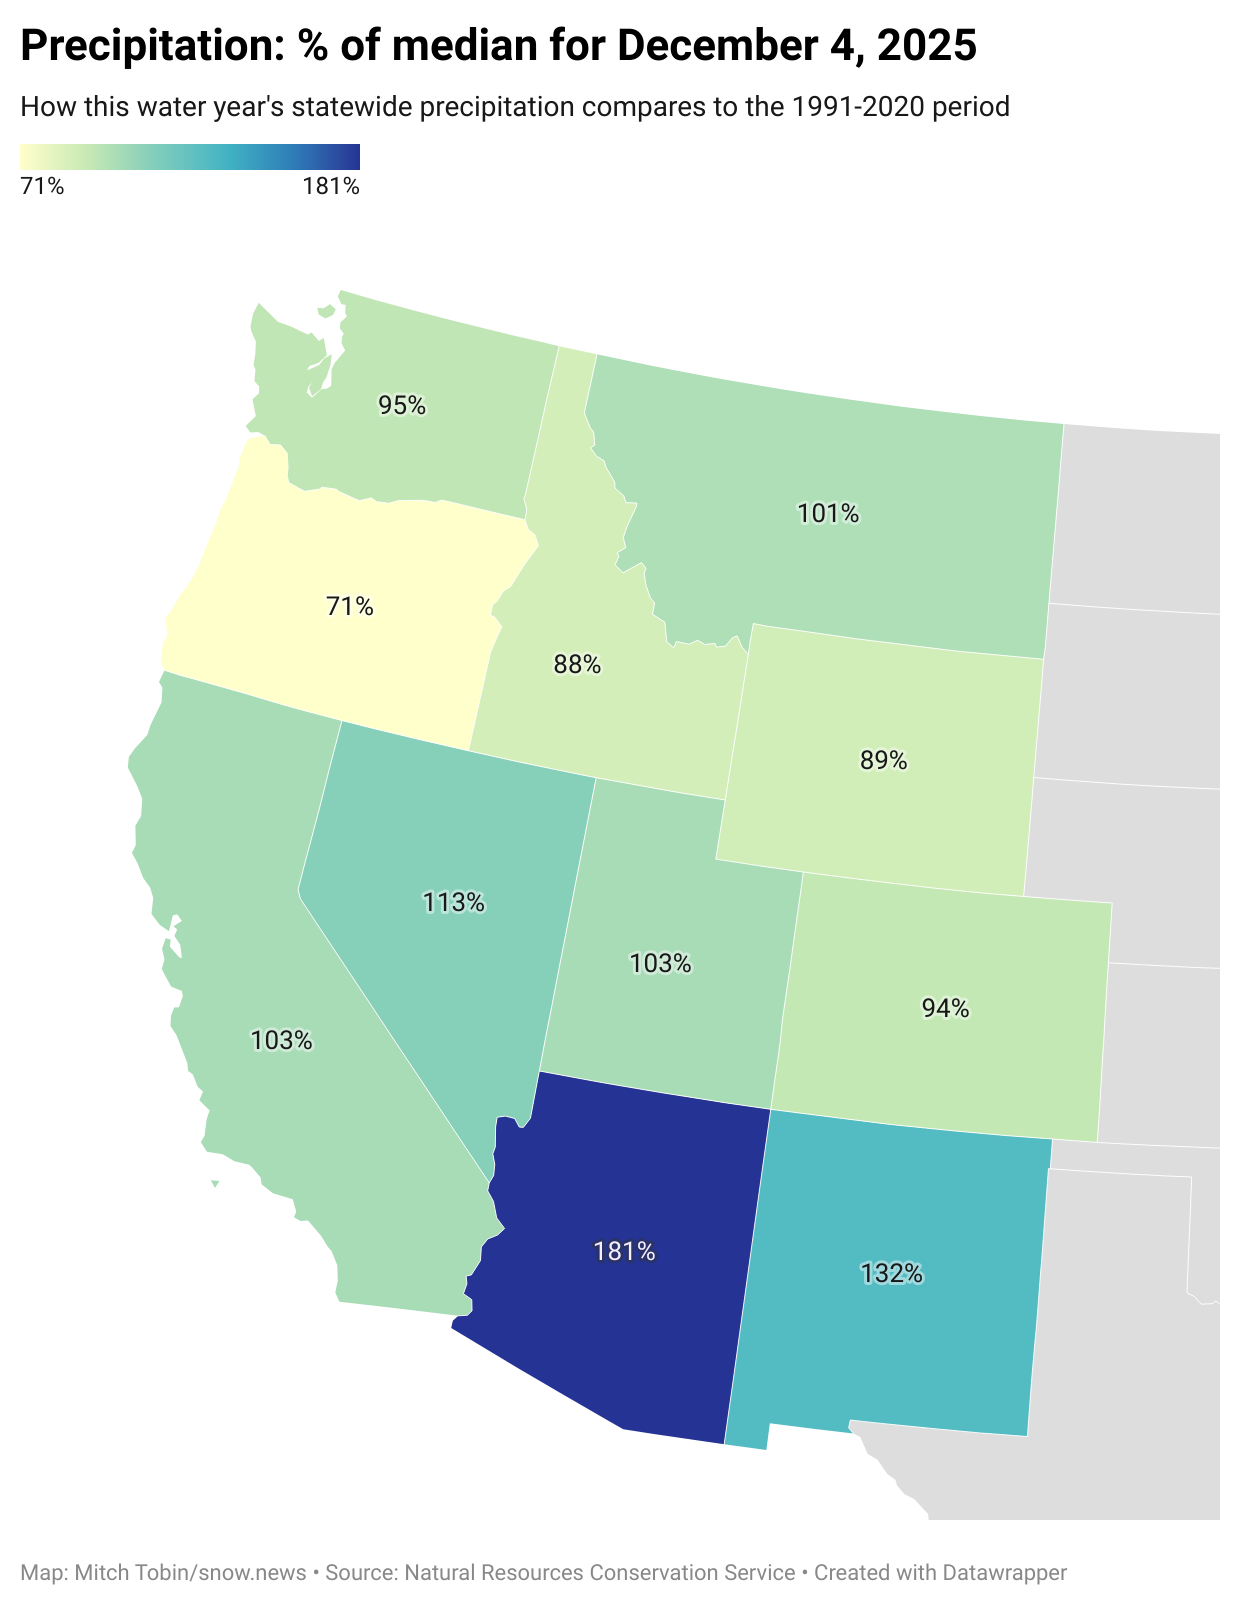
In short, it’s been a decent water year thus far for moisture in the West, but not for snow, with warmer temperatures causing raindrops to fall instead of snowflakes.
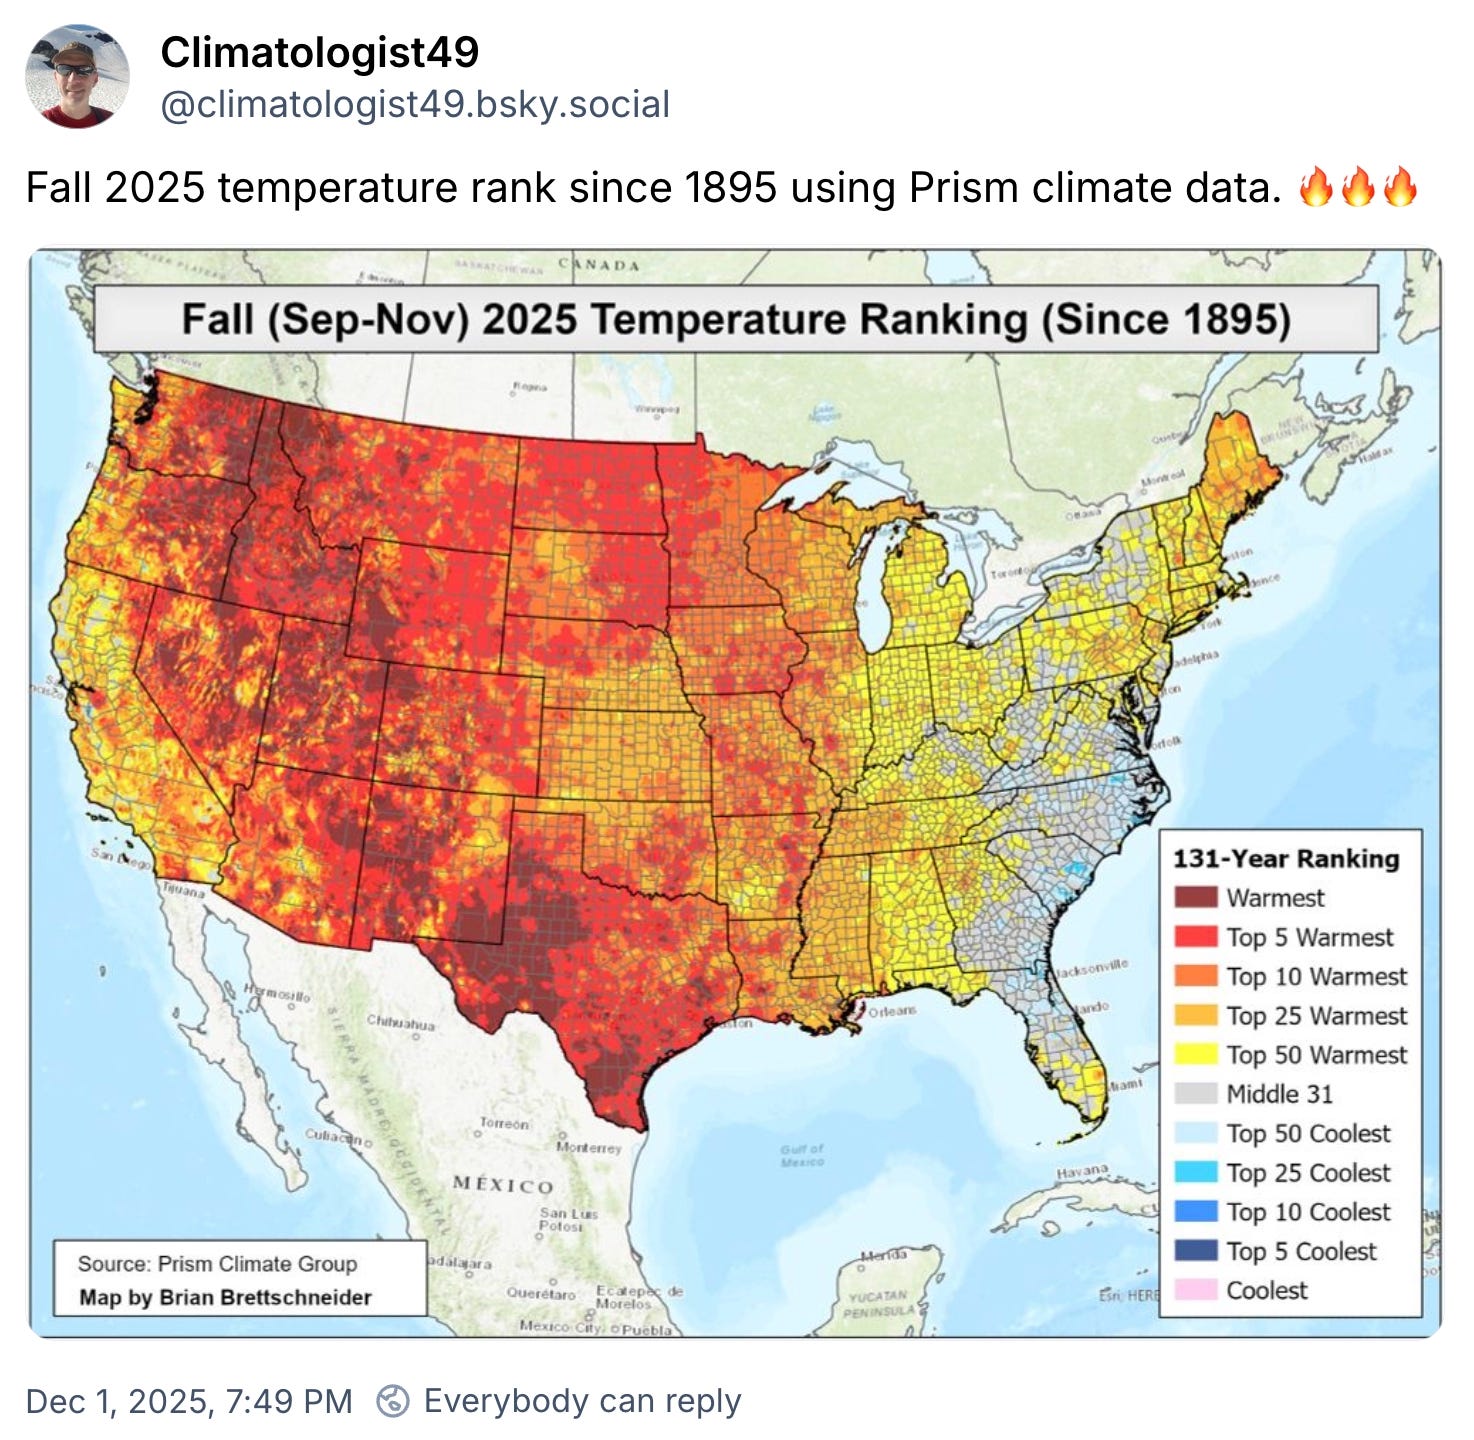
How warm has it been this fall? Check out this map that climatologist Brian Brettschneider posted on Bluesky:
The rainy conditions weren’t helpful for launching the ski season—some Western resorts delayed their openings—but the moisture at least improved drought conditions in some places.
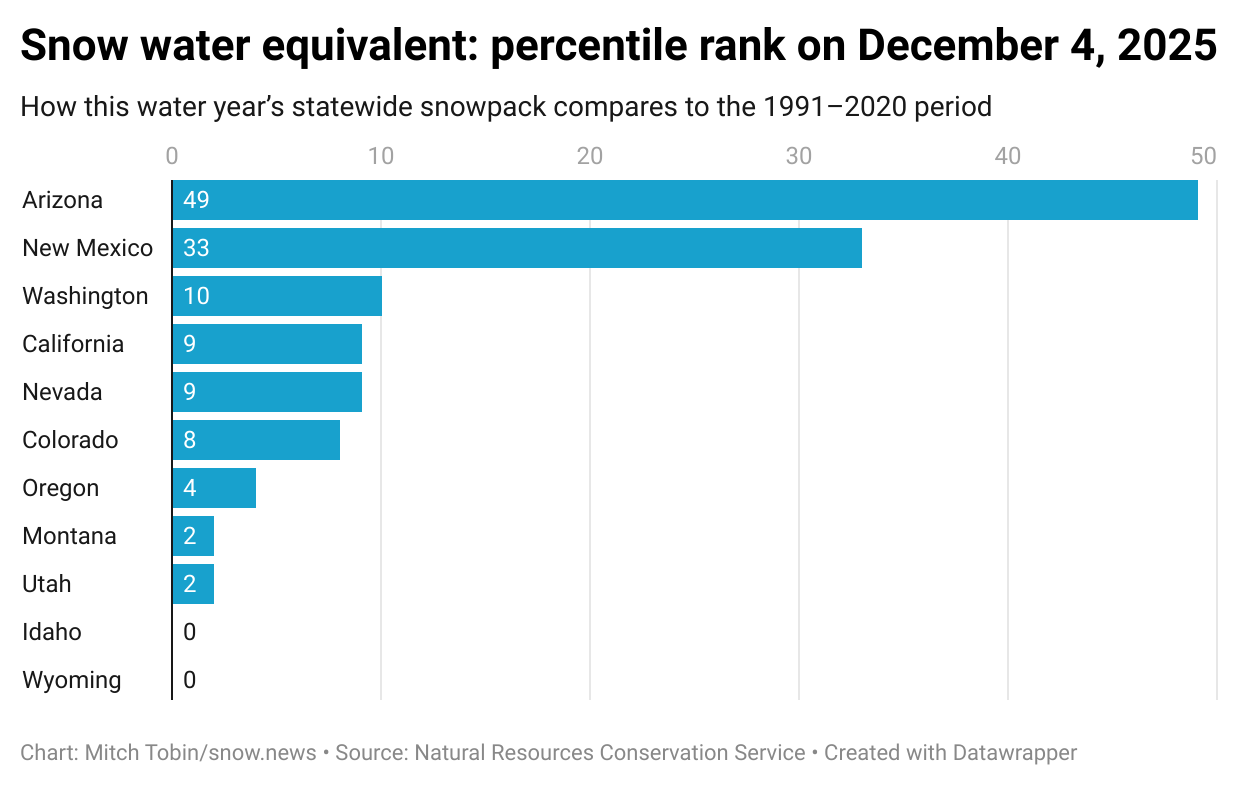
The chart below shows the percentile rankings for the statewide snow water equivalent, a measure of the snowpack’s water content. Those “0” readings for Idaho and Wyoming mean the snowpack in these states was essentially at record-low levels for December 4 when measured against the 1991-2020 period of record.1
Drilling down into the West, the map below shows basin-by-basin figures for snow water equivalent on December 3.
If you’d like to learn more about online resources for monitoring the snowpack, I published a cheat sheet last year that provides links to helpful websites and explains the various methods used for tracking snow water equivalent:

SnowSlang: N is for “nor’easter”
This newsletter focuses on the American West, but I spent my first quarter-century of life in New York, Connecticut, and Washington, D.C., so my early exposure to snowfall was shaped by East Coast weather patterns.
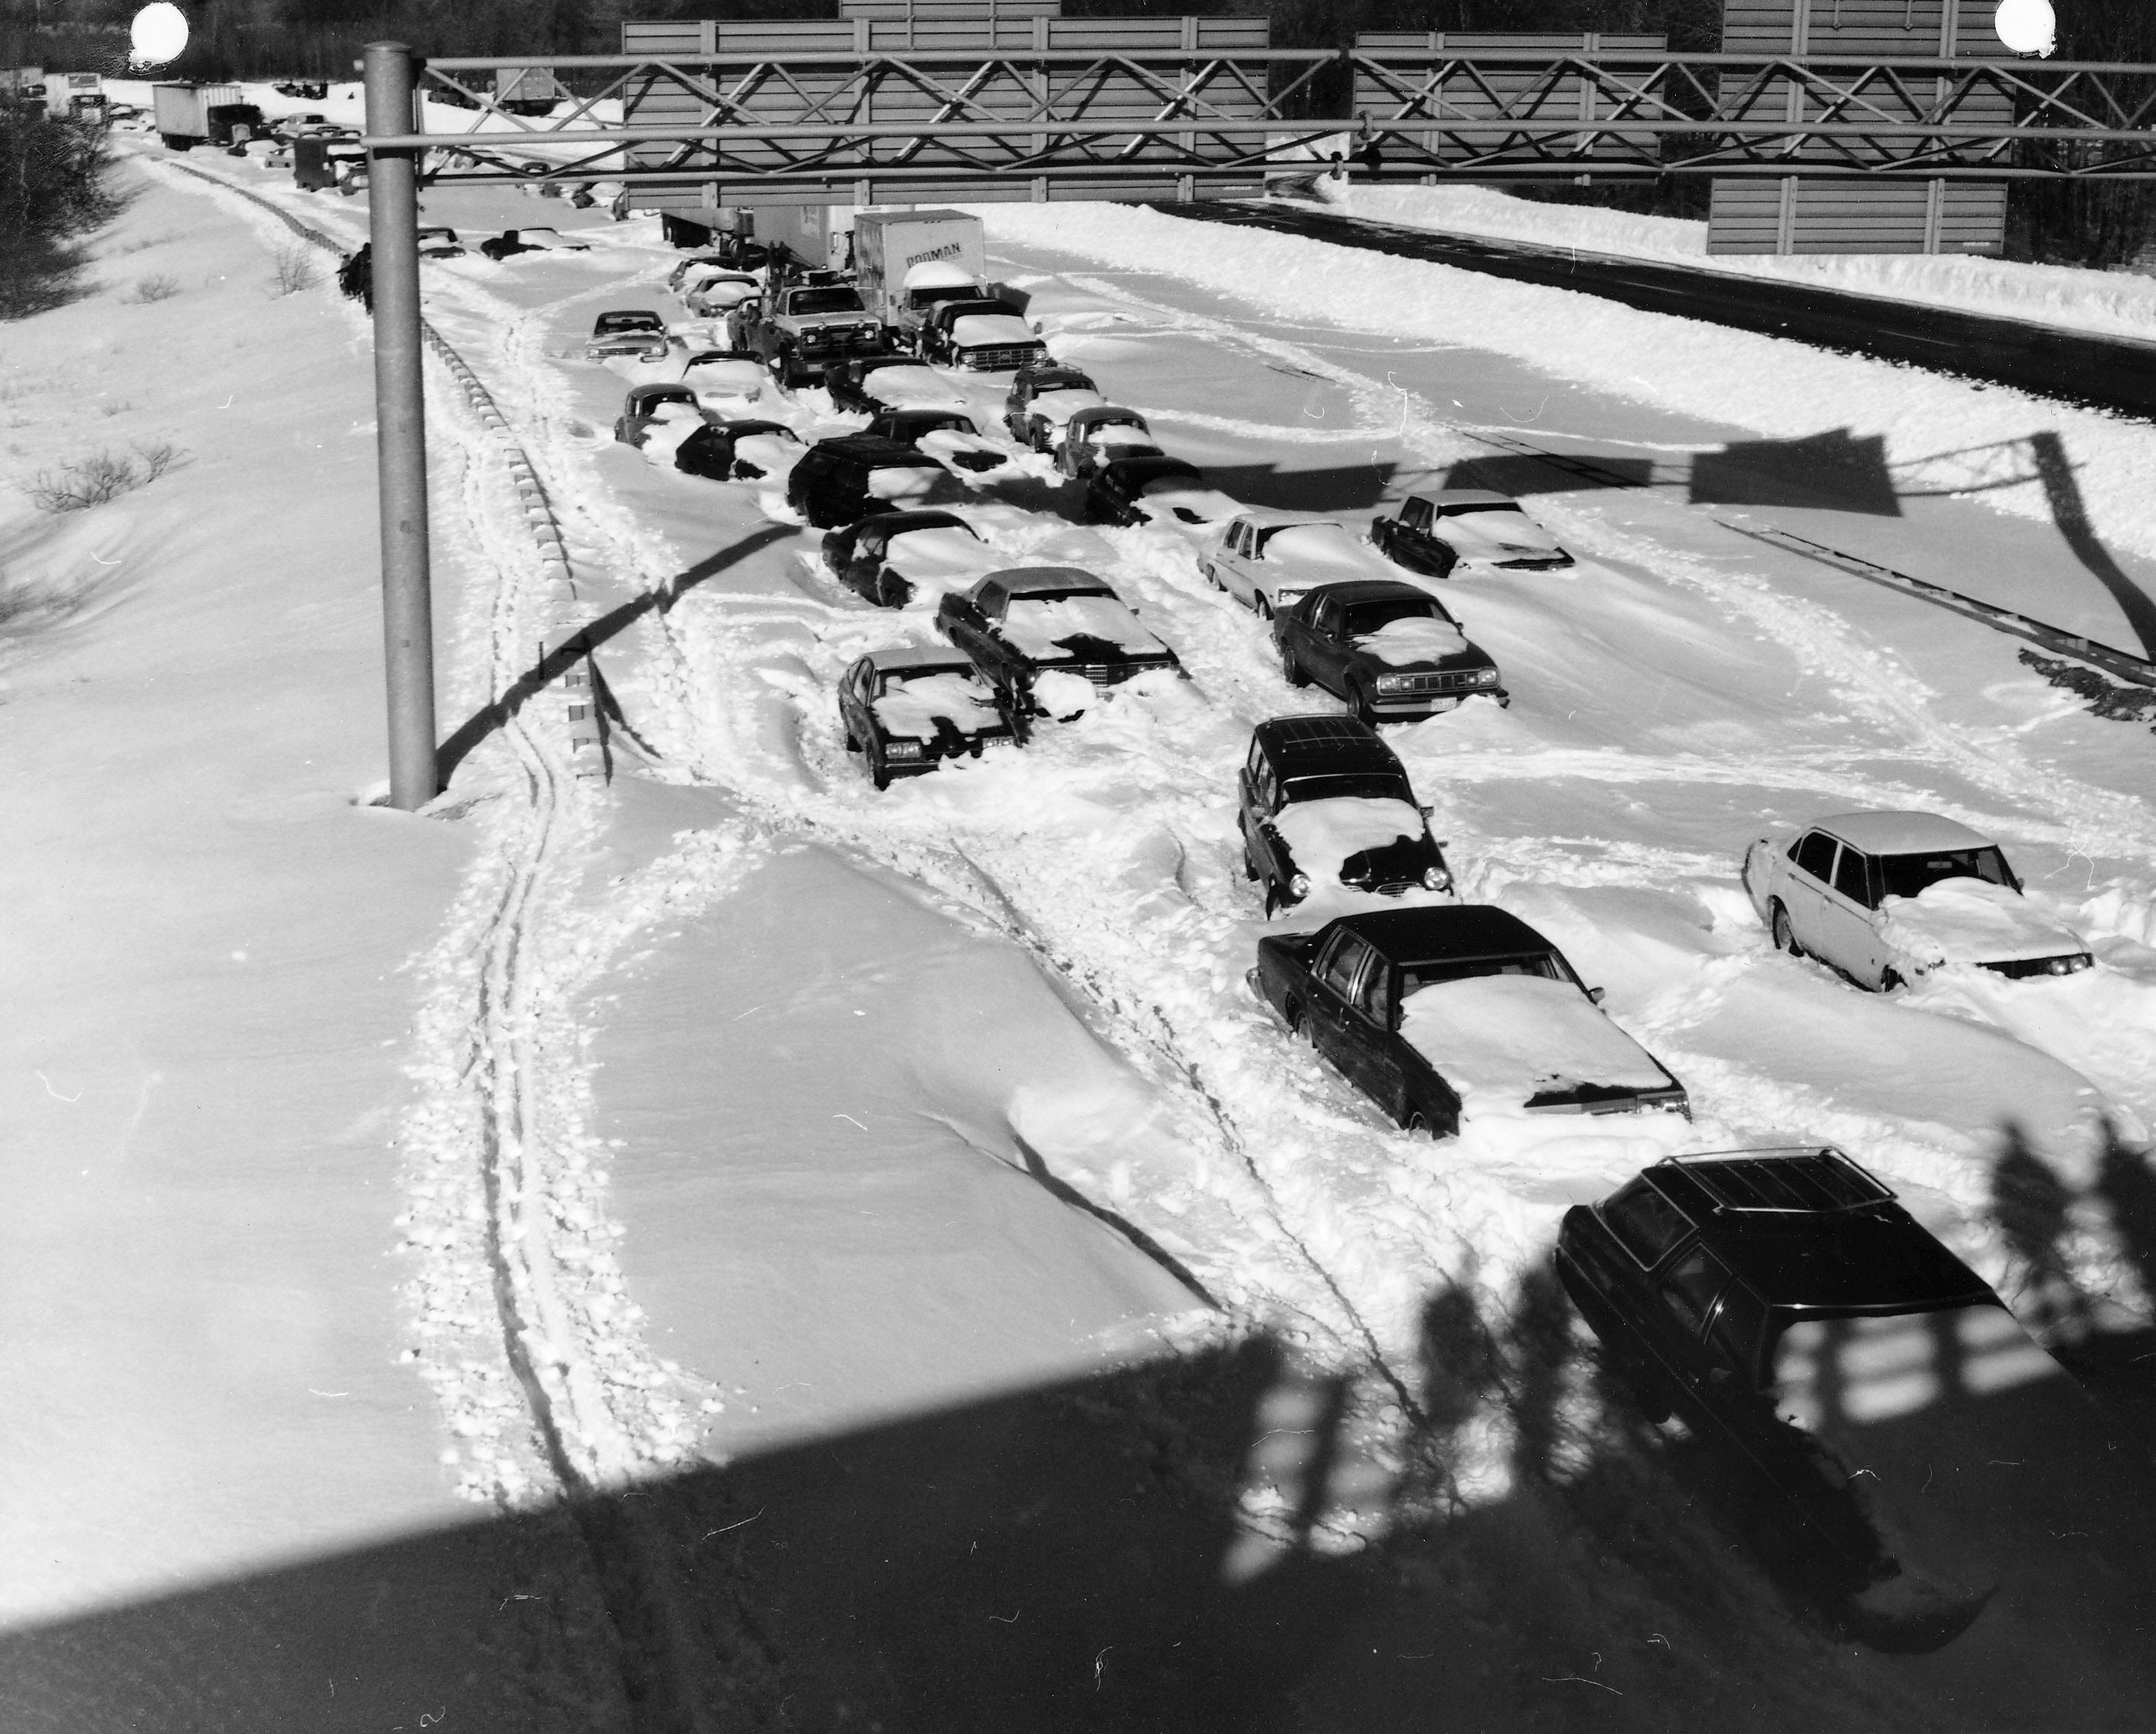
One of my strongest childhood memories of snow was formed in 1978, when I was eight years old, and a so-called nor’easter storm buried much of New England and the New York metropolitan area. The Blizzard of 1978, as it became known, dumped several feet of snow, killed about 100 people, and paralyzed the region for days, according to the National Weather Service.
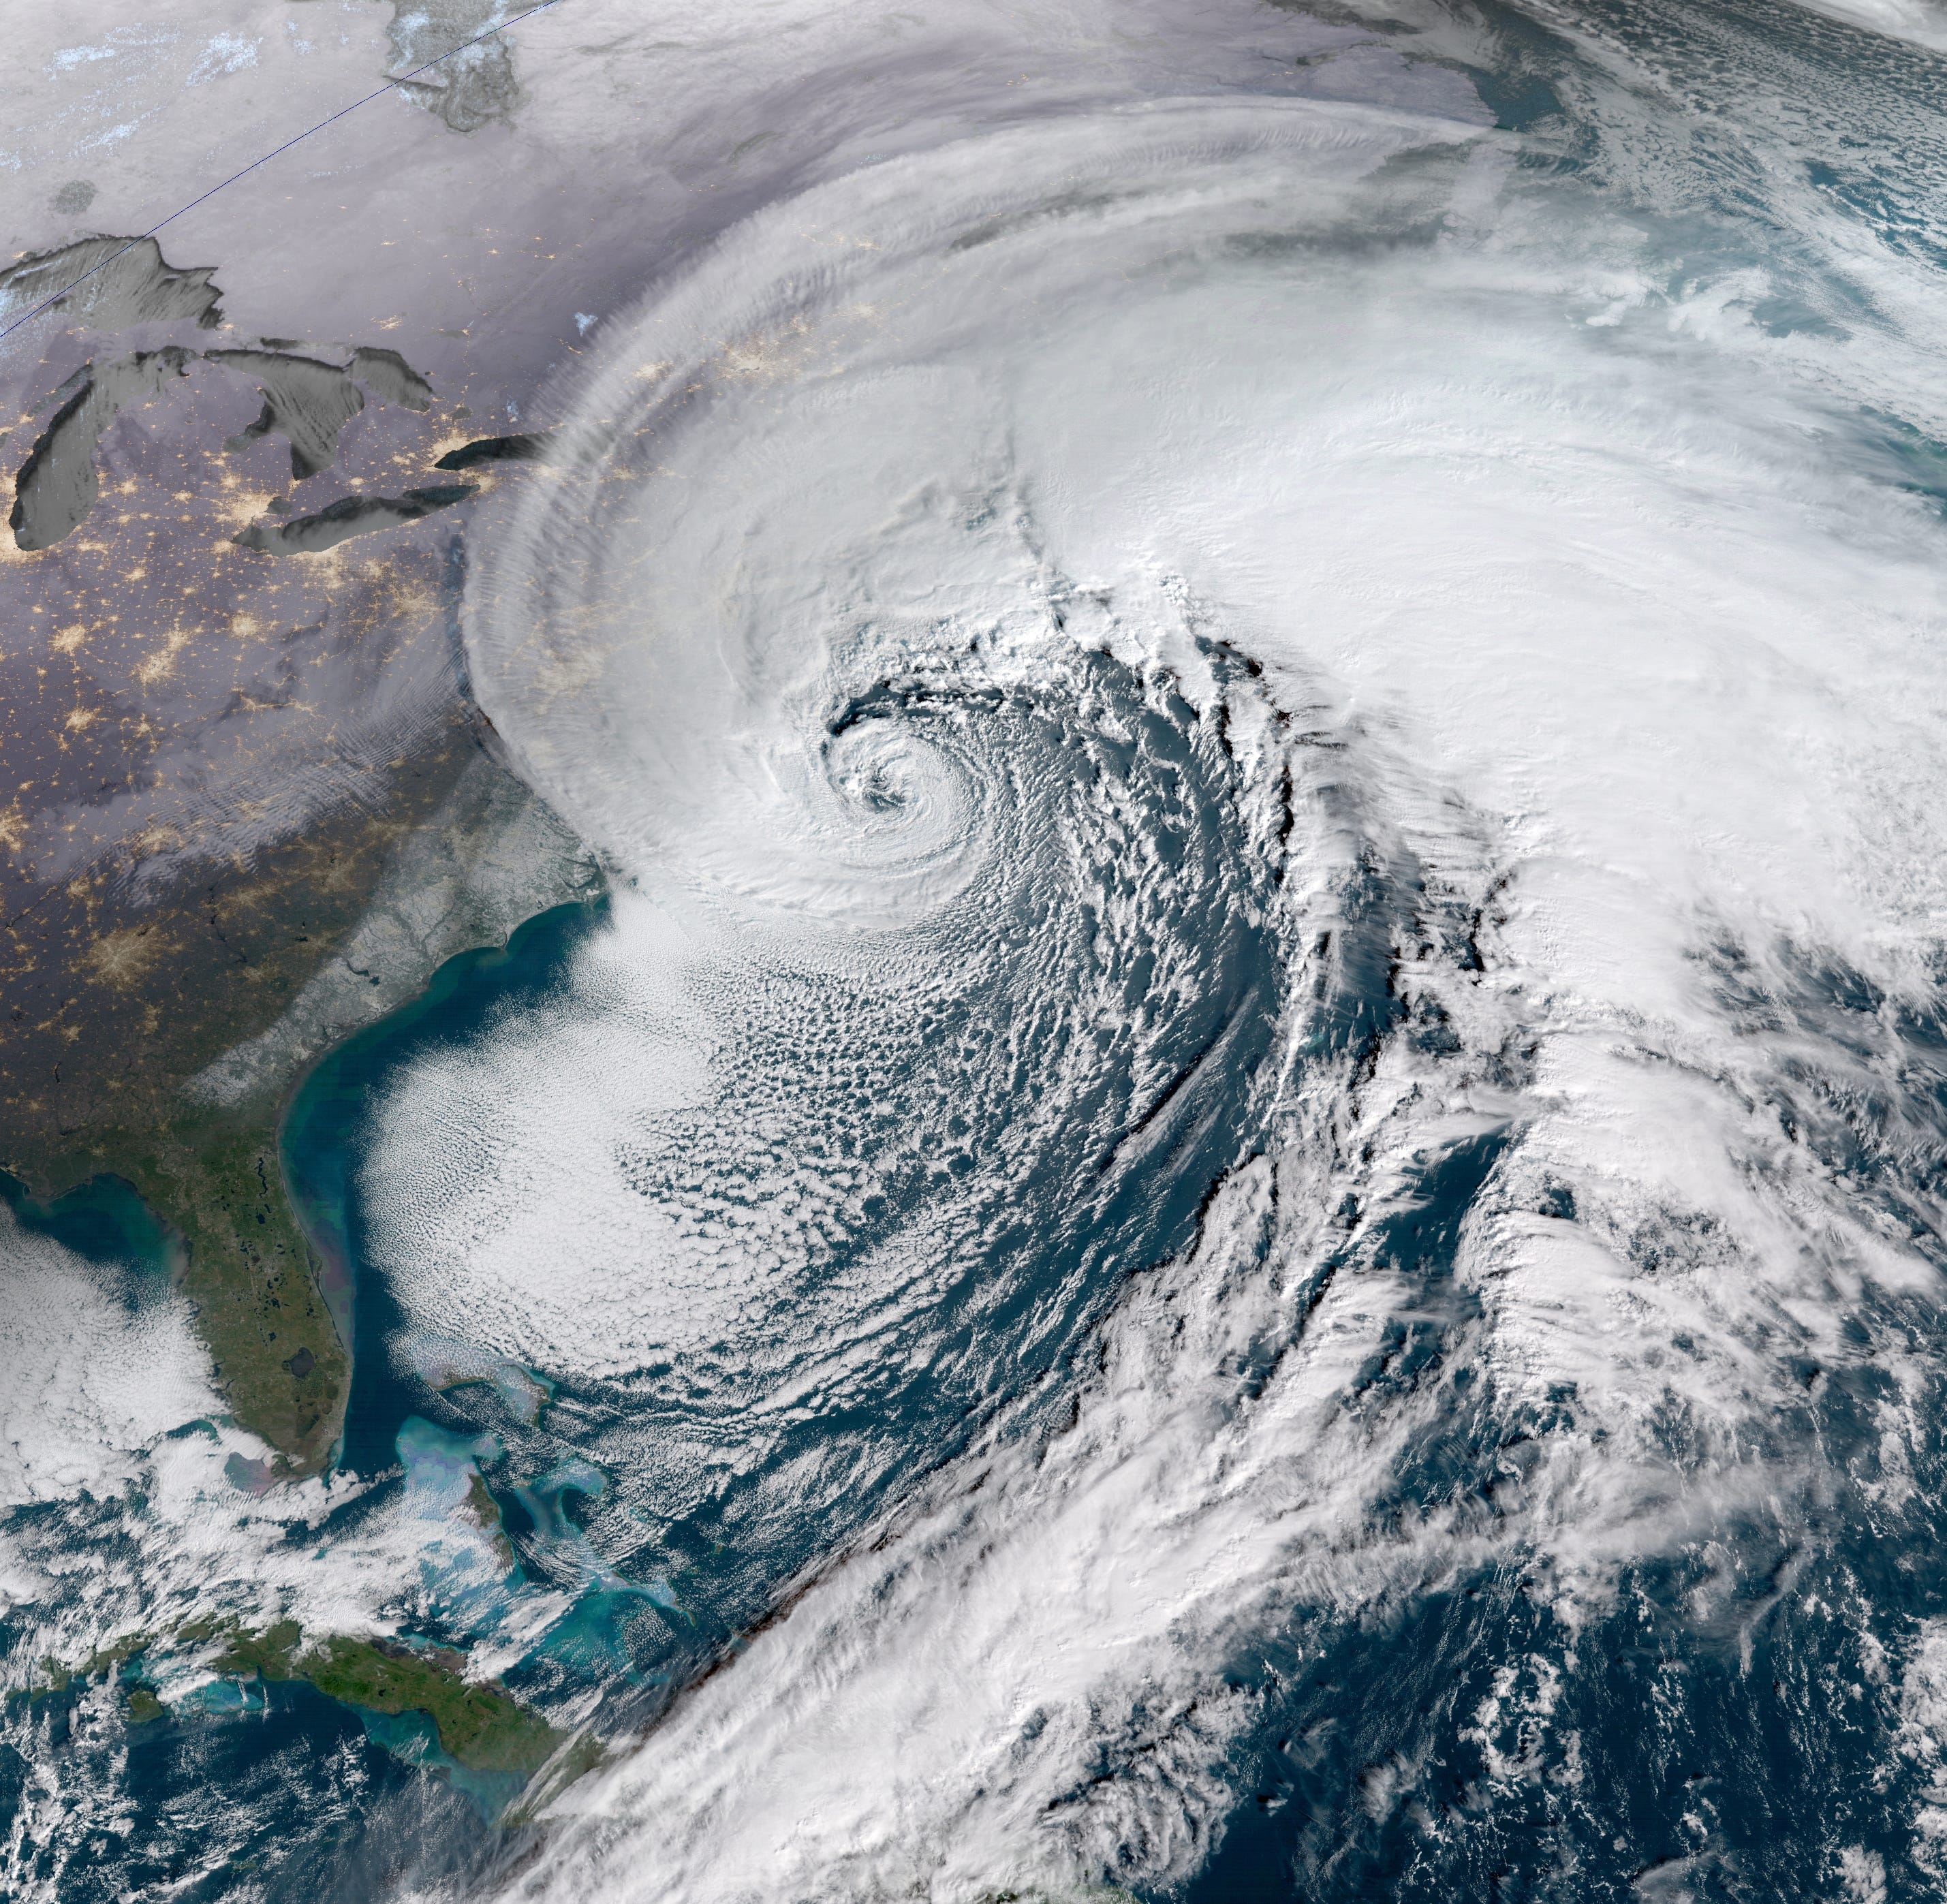
A nor’easter is a strong low-pressure system in the middle latitudes of the western North Atlantic Ocean that can deliver hurricane-force winds and deluges of precipitation, both liquid and frozen. Technically, a nor’easter is a type of extratropical cyclone (hurricanes are tropical cyclones that form at lower latitudes).
The name “nor’easter” stems from the typical northeasterly winds that are experienced along the coast when cold air, often originating in Canada, collides with warm and wet air over the Atlantic, as shown in the graphic below.

When a frigid Arctic air mass crashes into the toasty Gulf Stream current, the atmosphere can get a little crazy, whipping up blizzards, flooding, and coastal erosion. More from the National Weather Service:
Some well known Nor’easters include the notorious Blizzard of 1888, the “Ash Wednesday” storm of March 1962, the New England Blizzard of February 1978, the March 1993 “Superstorm” and the recent Boston snowstorms of January and February 2015. Past Nor’easters have been responsible for billions of dollars in damage, severe economic, transportation and human disruption, and in some cases, disastrous coastal flooding.
In a previous post, I wrote about bomb cyclones, which are rapidly strengthening extratropical cyclones. They’re defined by a precipitous drop in atmospheric pressure of at least 24 millibars in 24 hours, so some nor’easters meet the threshold and count as bomb cyclones. But many nor’easters develop more slowly and don’t attain bombogenesis, a term that I adore!
After forming, a nor’easter usually travels northeastward along the East Coast before moving out to sea. Winter incarnations are the best-known and most intense nor’easters, but the storm pattern can actually form year-round.
Since 1940, the strongest nor’easters have been getting stronger in both their maximum wind speeds and hourly precipitation rates, according to a July 2025 study in the Proceedings of the National Academy of Sciences. After studying 900 nor’easters, the researchers concluded that about 10.6 such storms happen each year.
Overall, extratropical cyclones are expected to decline in frequency due to climate change as rapid Arctic warming reduces the pole-to-equator temperature gradient. But there’s been an intensification of strong nor’easters “due to increased storm moisture, fueled by warmer ocean temperatures,” according to the study.
Because nor’easters can menace the heavily populated I-95 corridor, from Boston to Washington, D.C., the threat of their rising intensity “portends prospects of paralyzing snowfalls, dangerous storm surges, and episodic cold extremes, underscoring the urgent need for coordinated efforts to assess and mitigate the devastating impacts of future such storms,” the researchers write.
By the way, it turns out there’s something called a nor’wester, which signifies both a cloud formation in New Zealand and spring storminess in India and Bangladesh.
When I searched for so’easter, all I came up with were sites about Easter.
But a sou’wester is what you might see on the head of someone fishing for crabs or lobsters during a nor’easter. The Oxford English Dictionary defines it as “a large waterproof hat or cap, originally made of oilskin, with a broad rim, worn esp. at sea to protect the head and neck during rough or wet weather.” Wikipedia says the name stems from “the southwesterly wind which brings warm air from the tropics to the British Isles, often bringing rain as it cools over the sea.”

A quick note about paid subscriptions
I recently activated a paid subscription option for snow.news. Don’t worry—everything I publish remains free. I’m not putting anything behind a paywall or changing the content you receive.
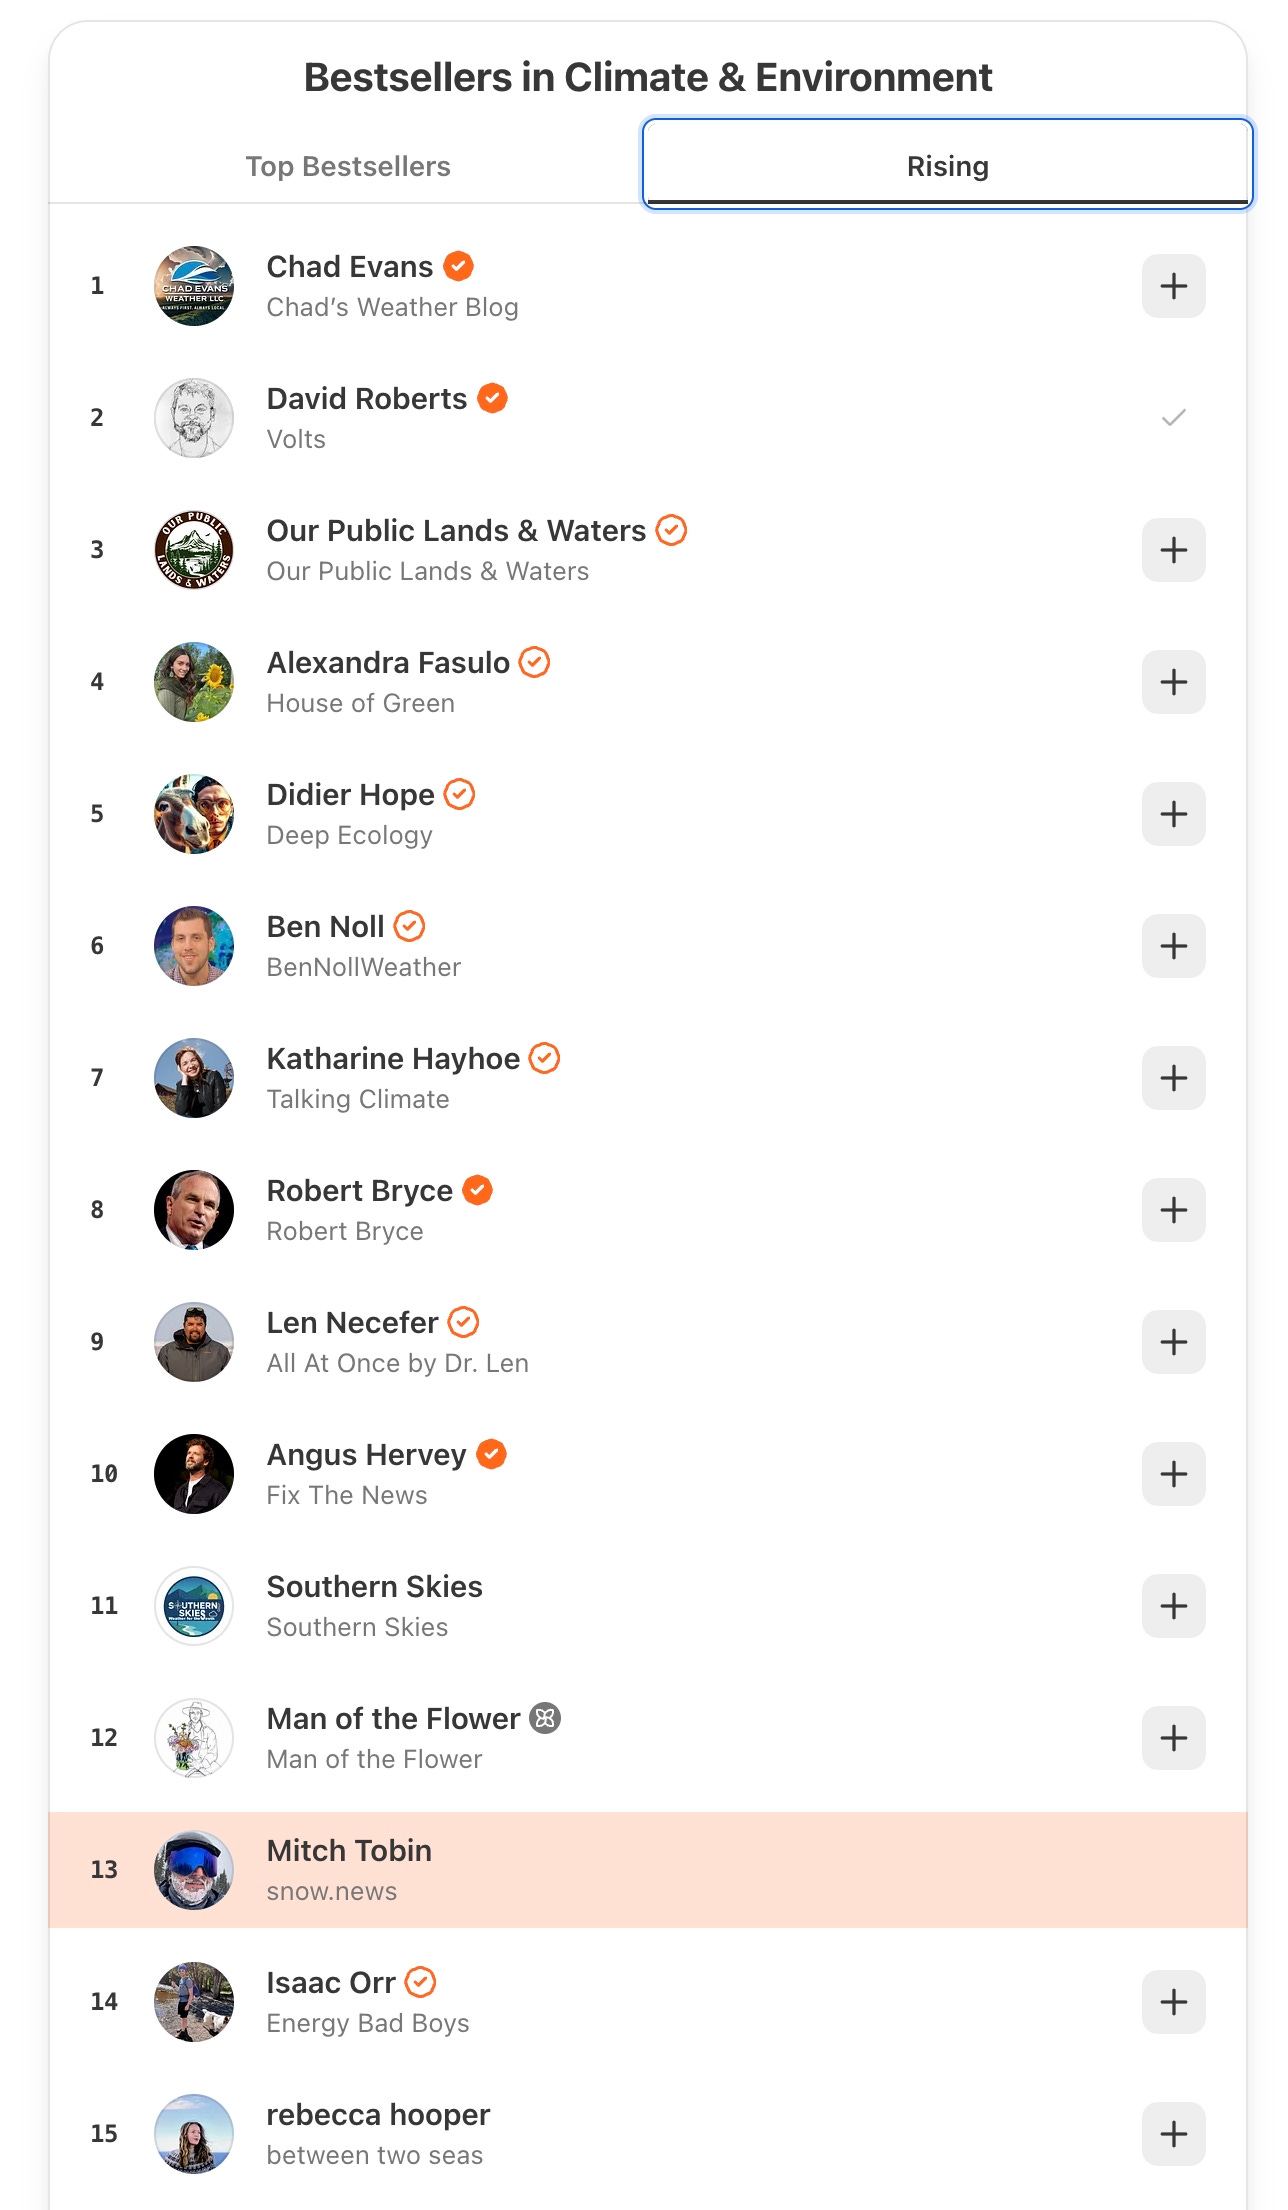
So why turn it on? Two reasons. First, some readers have asked how they can chip in to support the time and work that goes into these stories. Second, Substack’s algorithm significantly boosts newsletters that offer a paid tier, thereby raising their visibility. Case in point: after flipping the switch and gaining a few early paid subscribers, snow.news quickly shot up to #13 on Substack’s “rising” list for climate and environment newsletters, though it has since drifted back down.
If you’d like to pitch in and sustain my independent snow journalism, it’s $6/month or $60/year.
You can also purchase a gift subscription for any snow-lovers on your holiday list.
Thanks, as always, for reading and sharing snow.news. Your support—whether free or paid—helps keep this work going, and I’m deeply grateful.
If you’re scoring at home, you may have noticed that Arizona’s snowpack is 114% of the median but at the 49th percentile. This seeming mismatch isn’t an error because the median percentage compares today’s snowpack to the single middle year in the 1991-2020 period. But the percentile ranking considers all the years in that period, which is skewed by a few outliers.