Cheat sheet: monitoring the snowpack
What’s the current state of the snowpack? How have conditions changed over the season?

Here’s a resource that I created for The Water Desk that’s full of links to sites that track the American West’s snowpack. Am I missing something? Please email me with suggestions!
If you’re looking to gauge the depth and extent of the West’s snowpack, there are tons of helpful sources online that offer data, maps, and graphics on both current and historical conditions.
This post offers a cheat sheet to help navigate a variety of sites and briefly explains some of the technologies used to generate the data behind the visuals.
I’ve focused on websites that make it relatively easy for the general public to explore the data, especially with interactive maps, rather than pointing to more technical tools geared toward scientists and water managers.
For a helpful overview of these sites and others, plus much more about the West’s snowpack, see Snowpack Monitoring In The Rocky Mountain West, a 2020 user guide from the Western Water Assessment and Cooperative Institute for Research in Environmental Sciences at the University of Colorado Boulder.
SNOTEL and snow surveys
The most popular source for data on the West’s snowpack is the federal Natural Resources Conservation Service (NRCS), which provides a wealth of information from automated SNOTEL sensors and manually measured snow courses.
SNOTEL (as in SNOw TELemetry) is a network of around 900 sites that automatically measure the depth and water content of the snowpack while also providing data on temperature, precipitation, and other climatic conditions. The stations use a snow pillow filled with liquid antifreeze to measure the weight of the snow above and calculate snow water equivalent (SWE), the key measure of the snow’s water content.
While some stations use cellular and satellite communications, most use meteor burst technology to transmit their data by bouncing a signal off a band of ionized meteorites located 50 to 80 miles above the Earth.
The photo below from NRCS shows what a typical SNOTEL station looks like.

SNOTEL remains the backbone of snowpack monitoring in the West, but it does have limitations. The sites are typically found in high-elevation clearings where snow persists, so this sample of locations doesn’t capture the full gamut of conditions across the vast landscapes where snow accumulates. The SNOTEL station only collects data for a single point, but conditions may vary dramatically just a short distance away due to trees, wind, shade, and other factors.
In addition to using SNOTEL stations, the NRCS collects data manually in snow courses. Using skis, snowmobiles, or even helicopters, surveyors periodically travel to the sites and use a metal tube known as a snow sampler to collect data at a series of points along the snow course, which is typically 1,000 feet long. By pushing the hollow tube into the snowpack until it touches the ground, surveyors can extract a snow core that is weighed to calculate the SWE (see this page from the California Department of Water Resources for photos and info about how these surveys are done).
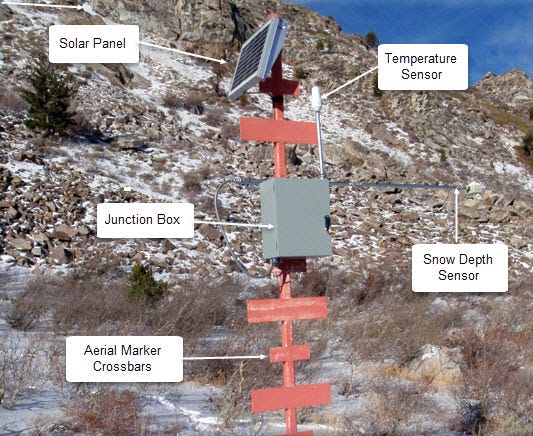
Aerial markers are also used to measure the snowpack in remote locations that are tough to access. These tall metal pipes have horizontal cross members that can be seen from an aircraft, allowing surveyors to measure the snow depth. With an estimate of the snow’s density, surveyors can calculate the SWE. In recent years, NRCS has outfitted some aerial markers with sensors, as shown in the photo below.
Several sites discussed below also use satellite data to monitor the snowpack, particularly images from the Moderate Resolution Imaging Spectroradiometer (MODIS). Although current satellite technology is unable to gauge SWE, the MODIS data does show whether snow is covering the ground while also providing information on melting, the size of snow grains, and other variables.
See this page from NRCS for more information on its snowpack monitoring. This page provides an overview of the NRCS snow surveys and its water supply forecasting.
Visualizing NRCS data
The best place to start is the National Water and Climate Center iMap, which allows you to create maps showing conditions at individual sites and basins (see this page for help on using the tool and this page for generating detailed reports).
The image below shows just one of the many views you can generate with the iMap tool. In this case, the map displays conditions on April 1, 2024, with the West’s many river basins shaded according to the percent of the median for 1991-2020. The circles show individual SNOTEL stations.
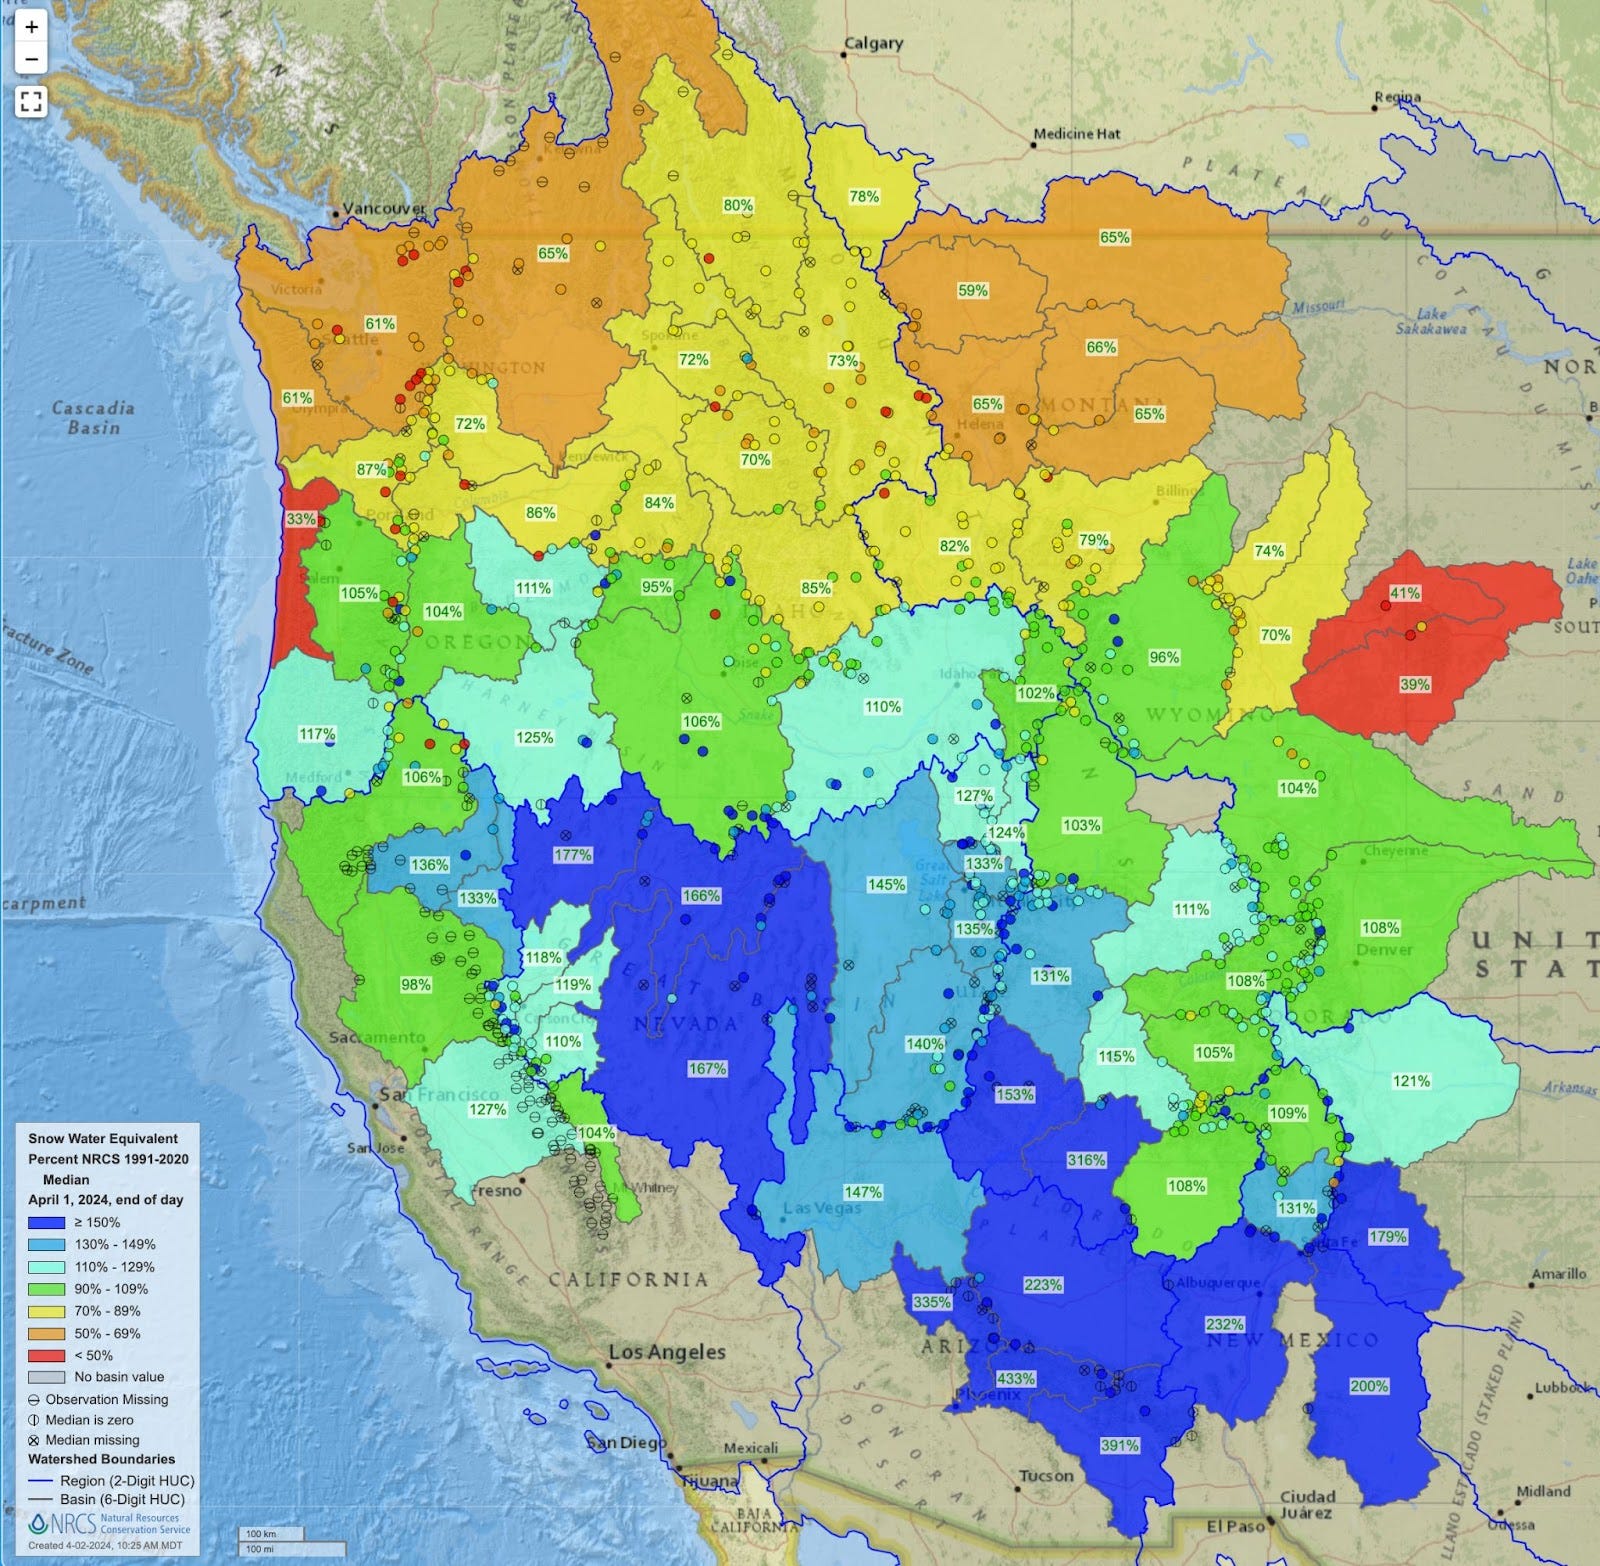
In addition to visualizing SWE, the iMap tool includes a ton of other data, including snow depth/density, soil moisture/temperature, streamflows, and reservoir storage.
This page from NRCS offers some pre-defined maps and reports on the West’s snowpack.
NRCS state-level data
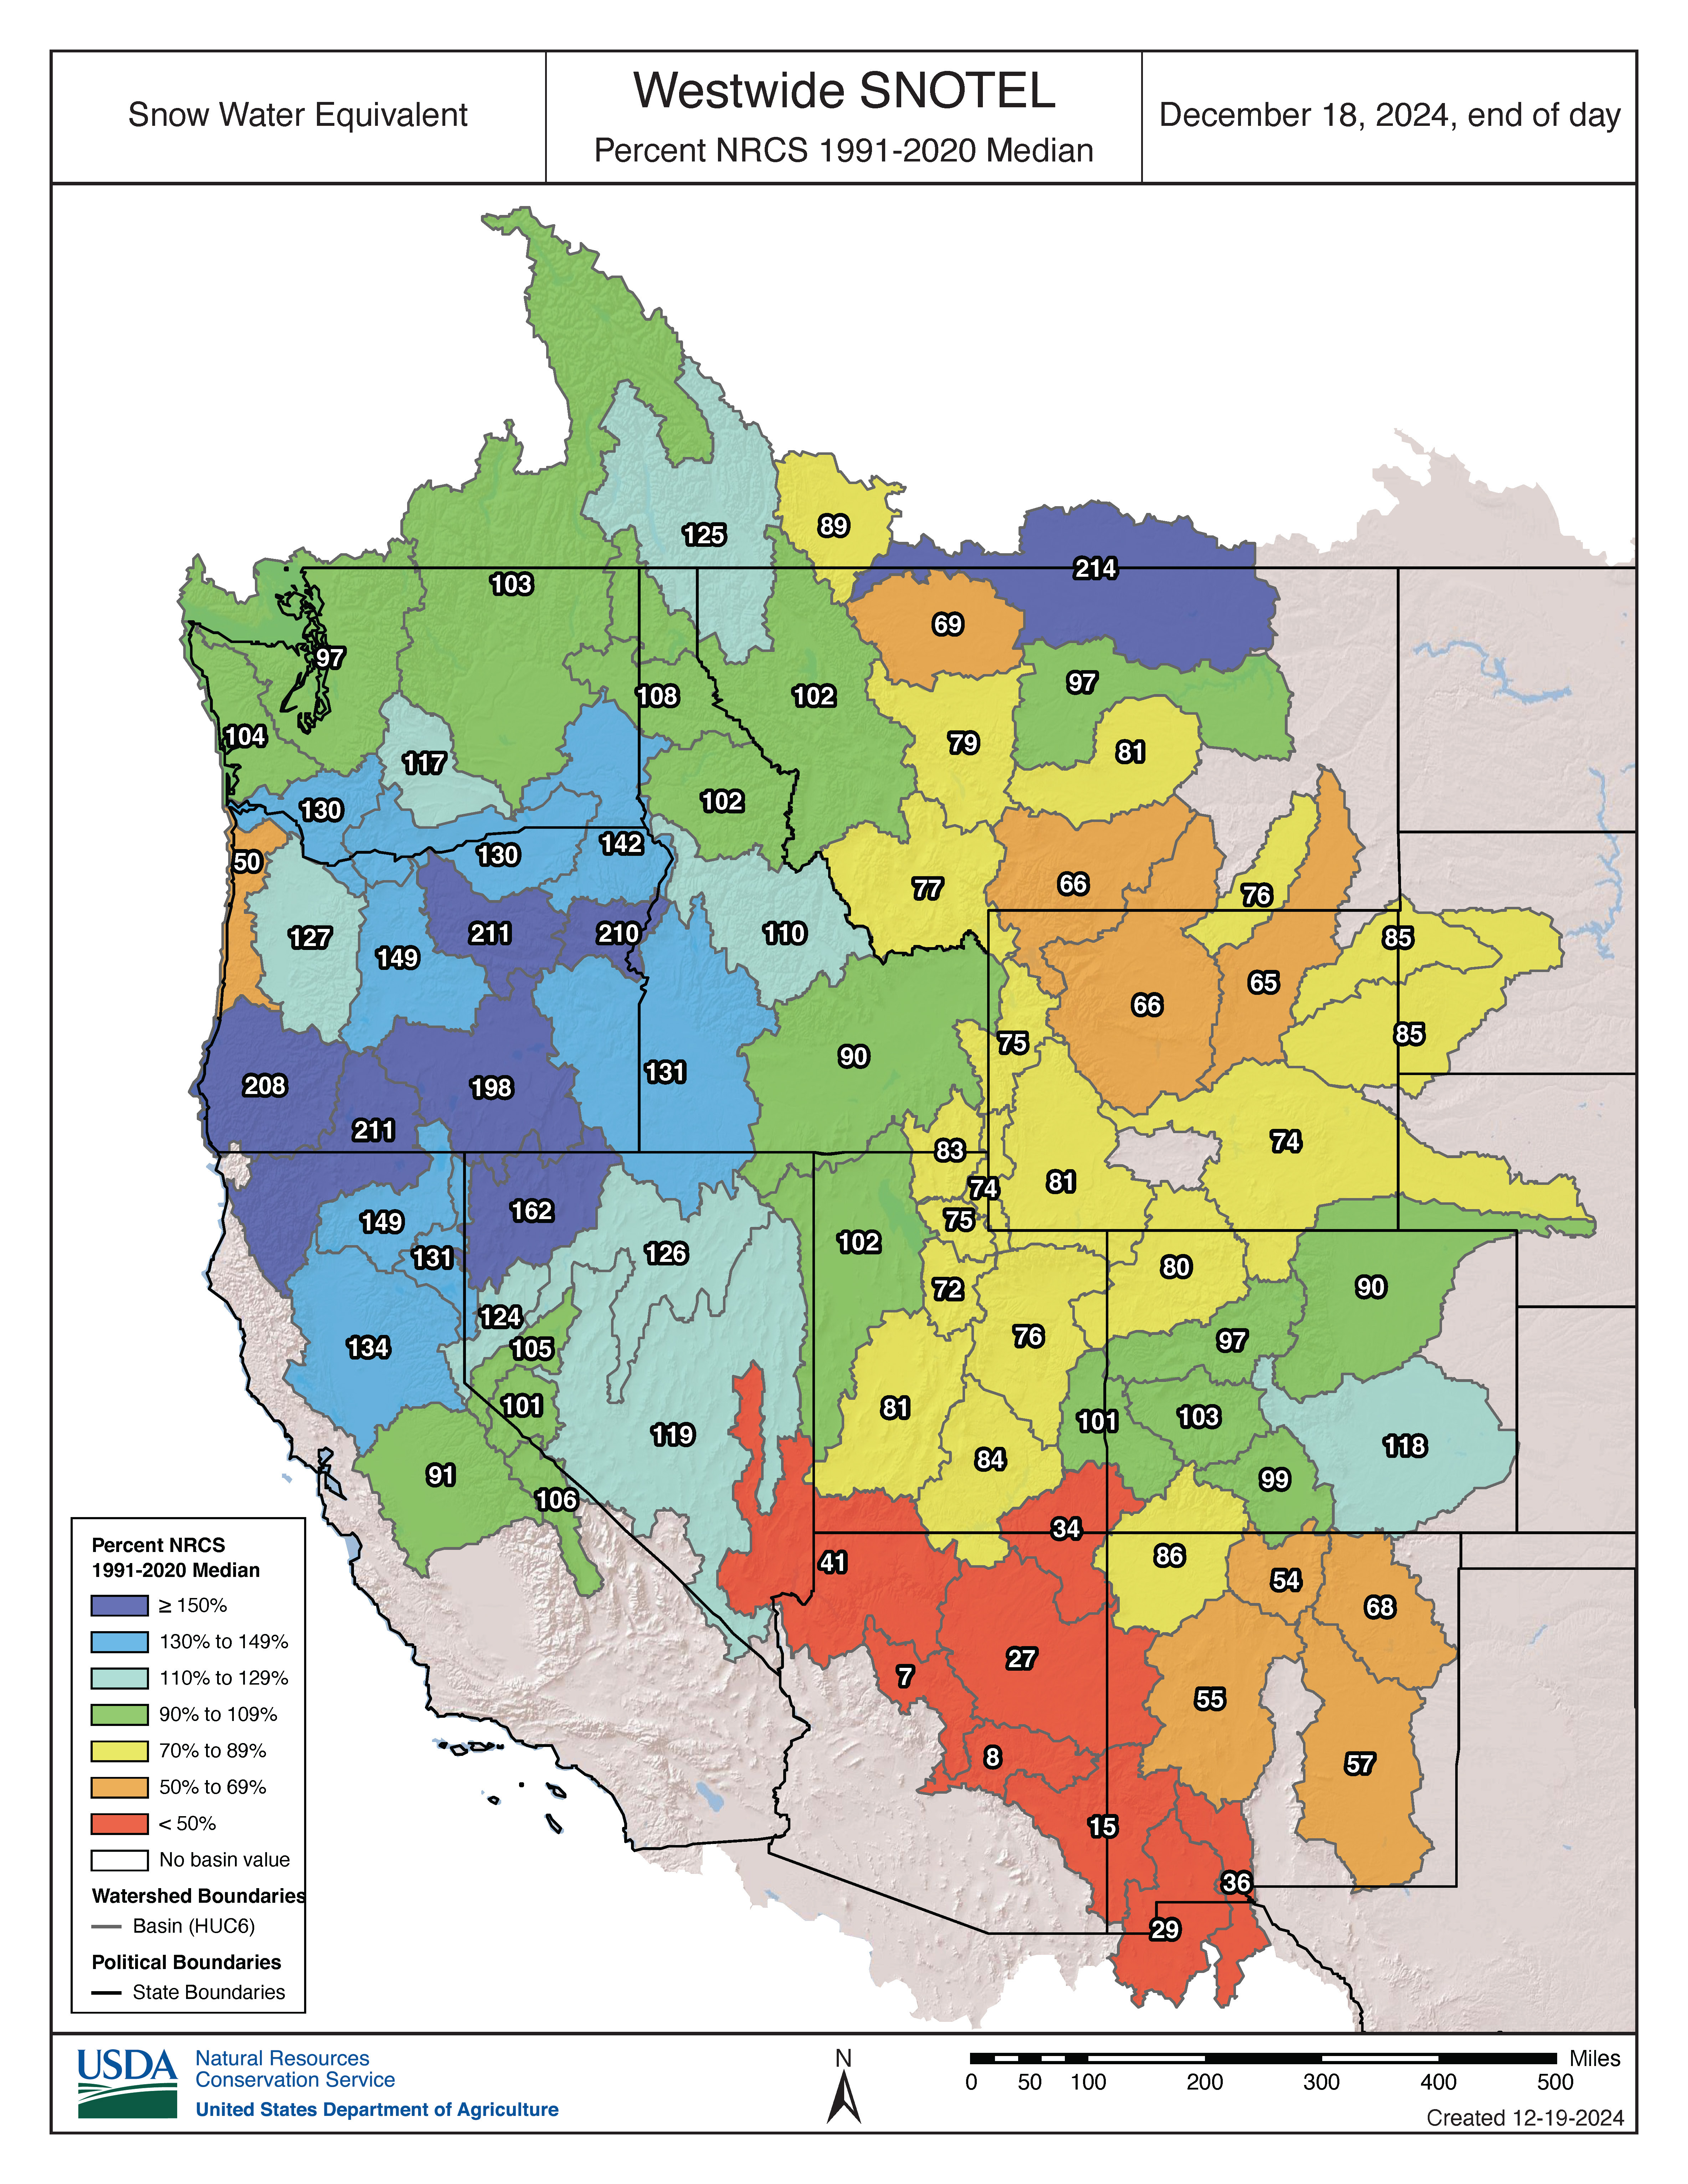
Another way to track the snowpack is by visualizing NRCS data for individual states. This page includes links to maps for 12 states and an overview of the West, as shown in the example below, which visualizes data for December 18 and shows a mixed bag across the region.
The map of Idaho below shows that the SWE on April 1, 2024, varied widely from north to south across the state.
On the NRCS state-level webpages, which I list below, you can view/download charts that show the coming and going of the snowpack over the season.
The December 18 chart below shows how the snowpack is doing in Utah this season. The black line plots the current winter’s snowpack and the green line shows the 1991-2020 median. The dark blue and dark red lines chart the maximum and minimum readings during the 30-year period of record.

As a bonus, you can also plot projections for snowpack for the remainder of the season. In the April 4, 2024, chart below, the dashed lines show a variety of possible trajectories for Colorado’s snowpack.

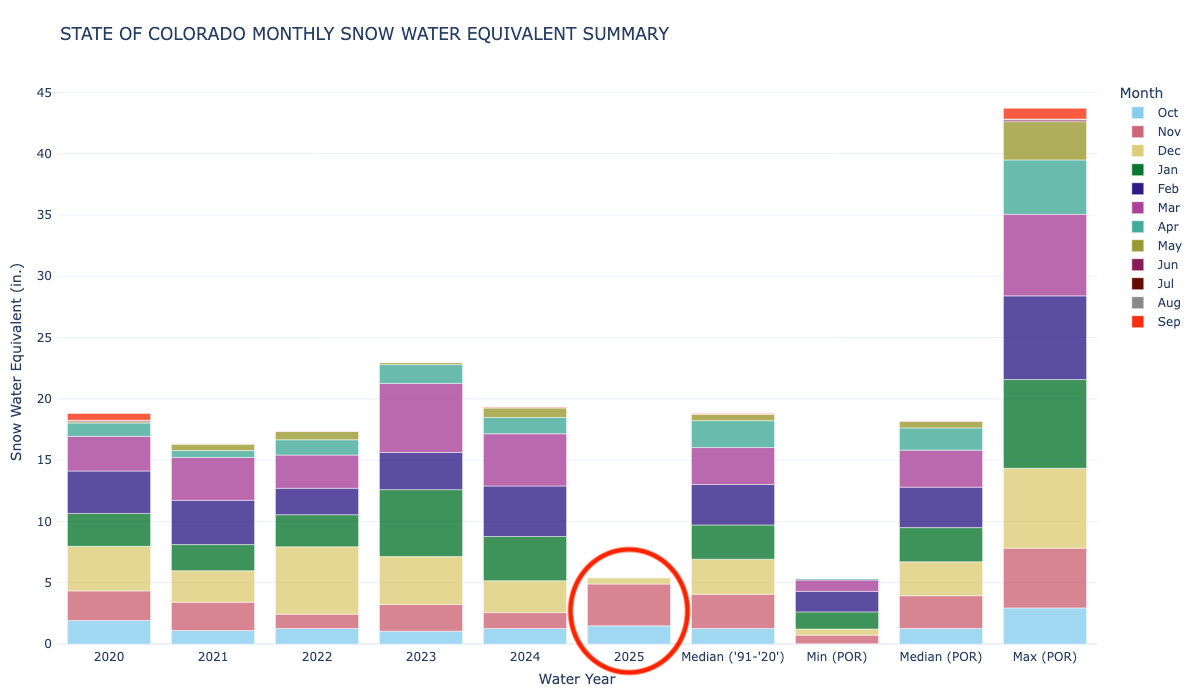
The graphic below is yet another way to visualize how the snowpack is stacking up. This December 18 chart for Colorado shows how much snow has accumulated each month, with the current water year circled in red. After a great November (salmon-colored bar), it’s been a lousy December (beige) for snow in Colorado’s high country.
Below are links to the state-level sites. The first link is the overview page, followed by “site plots,” where you can view/download charts for individual SNOTEL stations, and then “basin plots,” where you can do the same for specific river basins.
Alaska
Alaska’s Snow Survey, Site Plots, Basin Plots
Arizona
Arizona’s Snow Survey, Site Plots, Basin Plots
California
California Snow Survey, Site Plots, Basin Plots
Colorado
Colorado Snow Survey, Site Plots, Basin Plots
Idaho
Idaho Snow Survey, Site Plots, Basin Plots
Montana
Montana Snow Survey, Site Plots, Basin Plots
Nevada
Nevada Snow Survey, Site Plots, Basin Plots
New Mexico
New Mexico Snow Survey, Site Plots, Basin Plots
Oregon
Oregon Snow Survey, Site Plots, Basin Plots
Utah
Utah Snow Survey, Site Plots, Basin Plots
Washington
Washington Snow Survey, Site Plots, Basin Plots
Wyoming
Wyoming Snow Survey, Site Plots, Basin Plots
California’s snowpack
California is included in the SNOTEL data discussed above, but the state also has its own monitoring system for the snowpack.
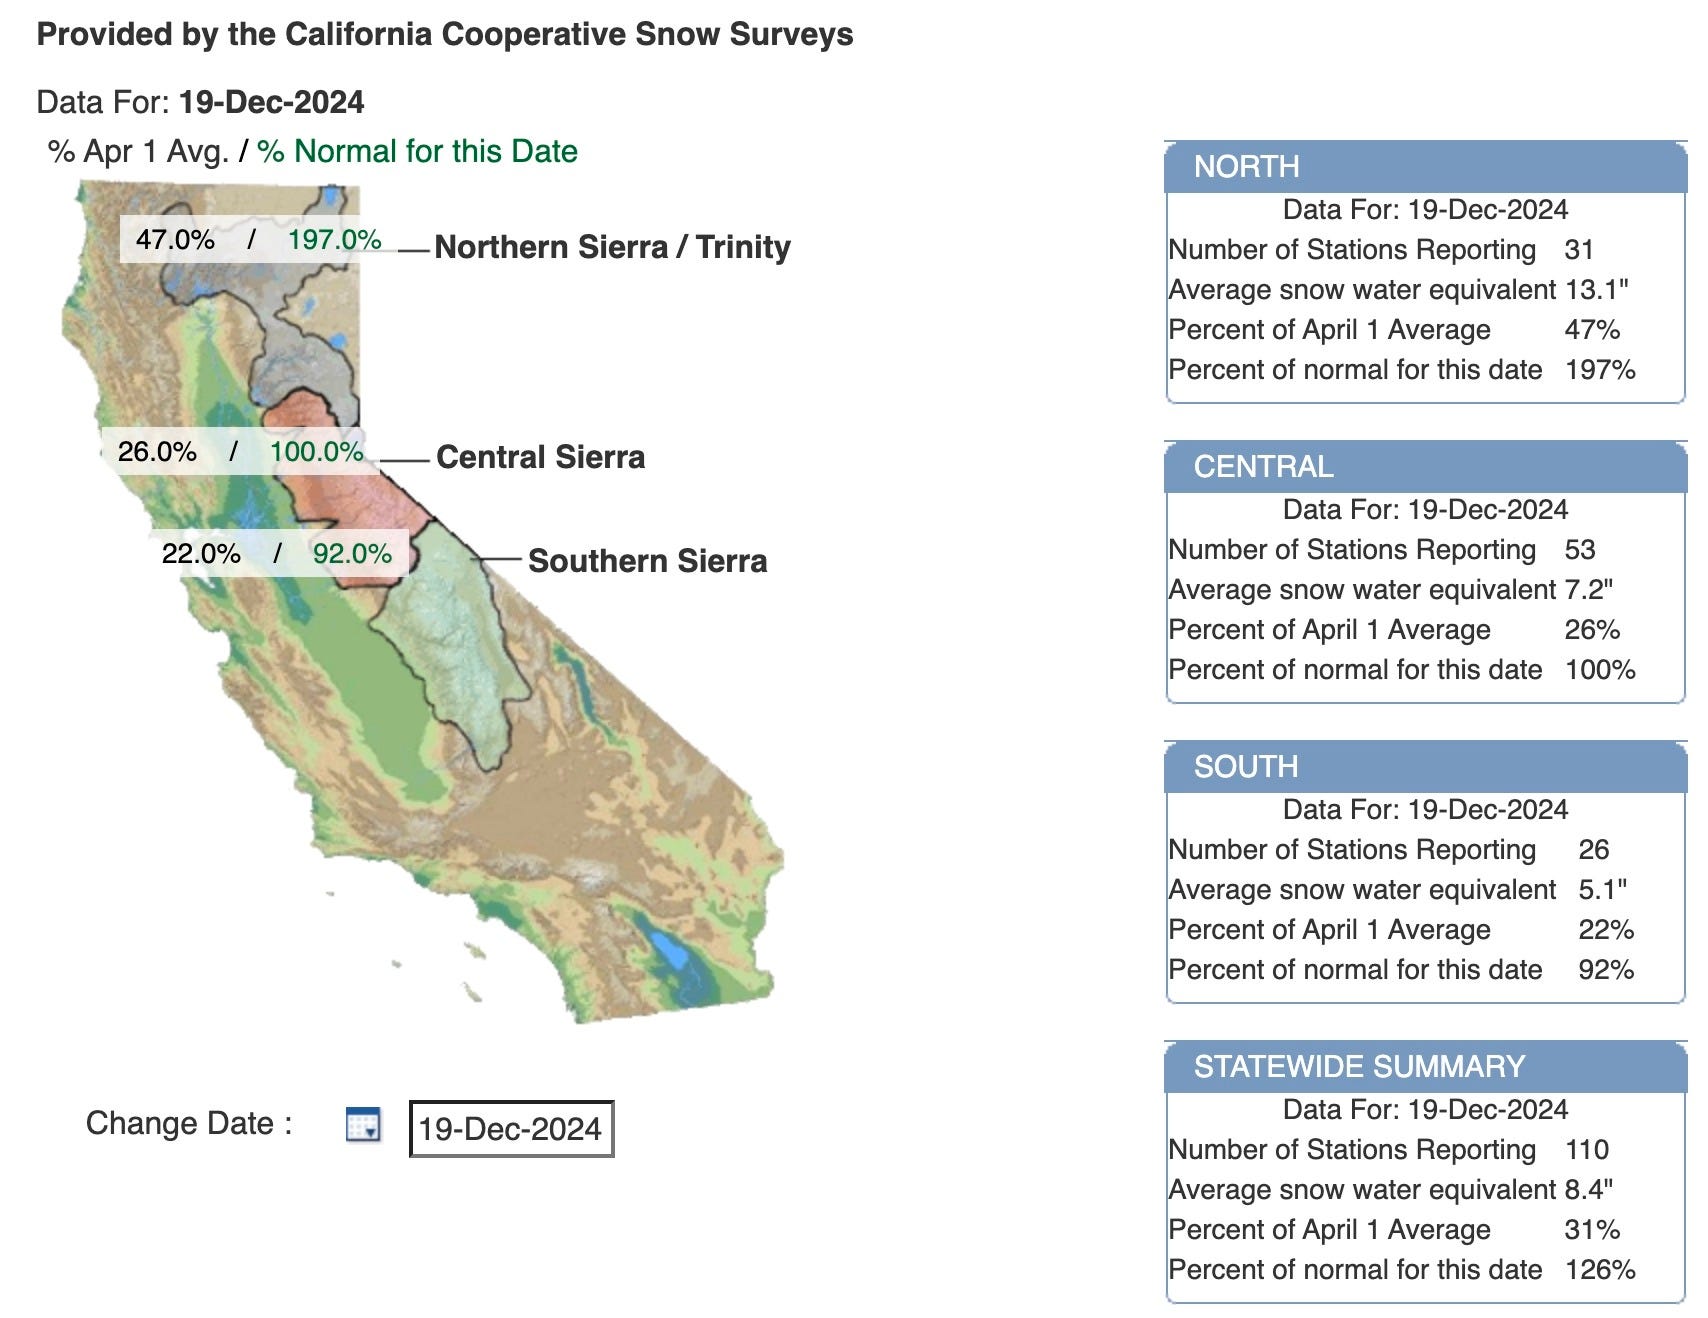
The California Cooperative Snow Surveys (CCSS) program, which was created by the state legislature in 1929, collects and analyzes data from more than 265 snow courses and 130 snow sensors located in the Sierra Nevada and Shasta-Trinity Mountains.
The December 19 graphic below from the California Department of Water Resources is from this page. A printable version of today’s conditions is on this page.
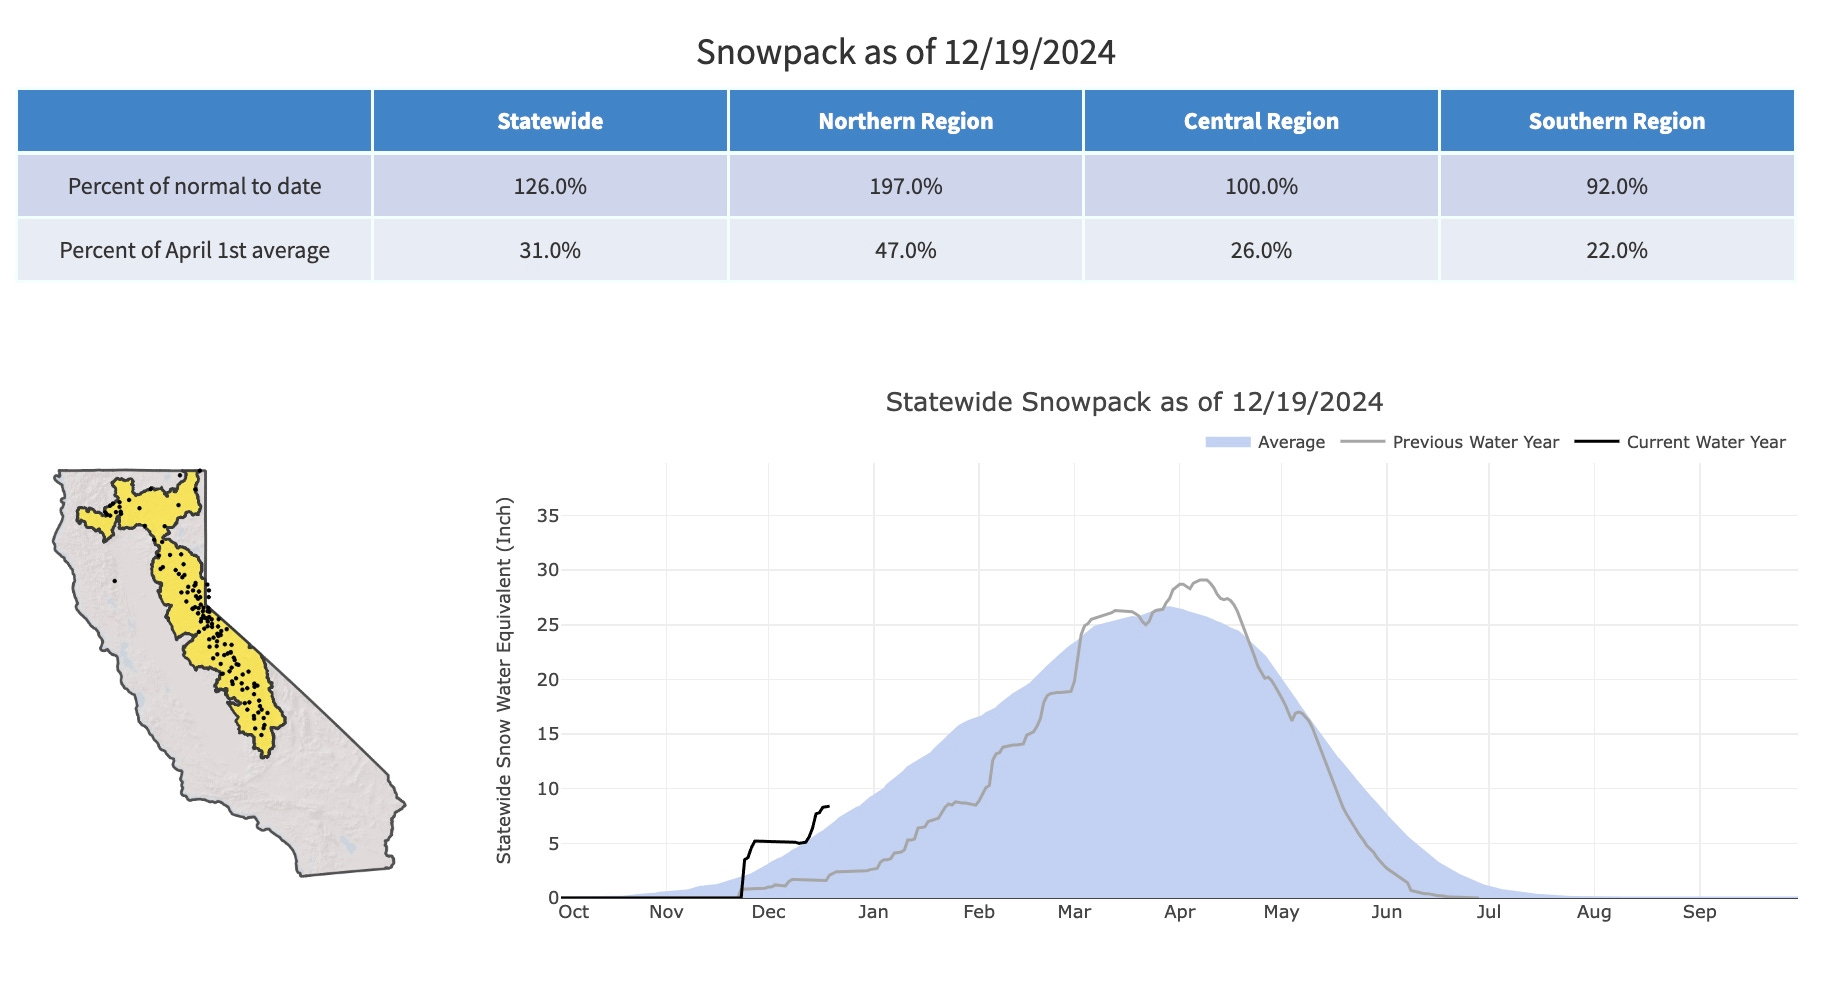
The agency also provides similar data through its SnowTrax page, which generates graphics like the one below for December 19.
SnowTrax also offers more sophisticated data visualizations here, here, and here.
Another page from the California Department of Water Resources offers additional data and graphics. For example, this page charts how the current year’s snowpack compares to recent years and the best/worst seasons in recent history.
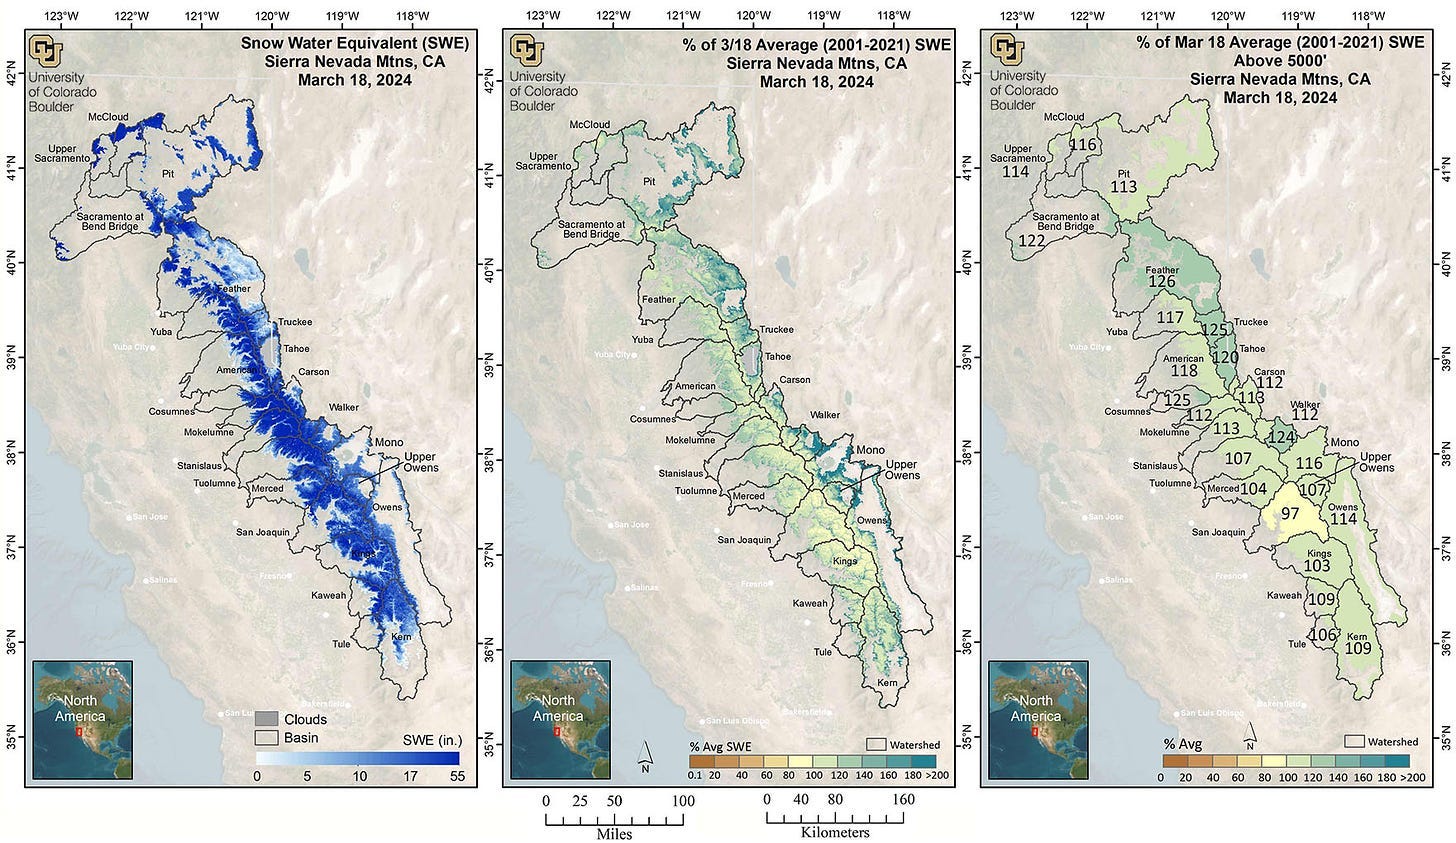
Detailed Sierra Nevada reports
If you’d like to see very detailed maps of the Sierra snowpack, check out this page from researchers at the Institute of Arctic and Alpine Research at the University of Colorado Boulder. These experimental products provide “near-real-time estimates” of SWE at a resolution of 500 meters (1,650 feet, or about 0.3 miles). They’re based on recent cloud-free satellite imagery and on-the-ground data from snow pillows and other sources.
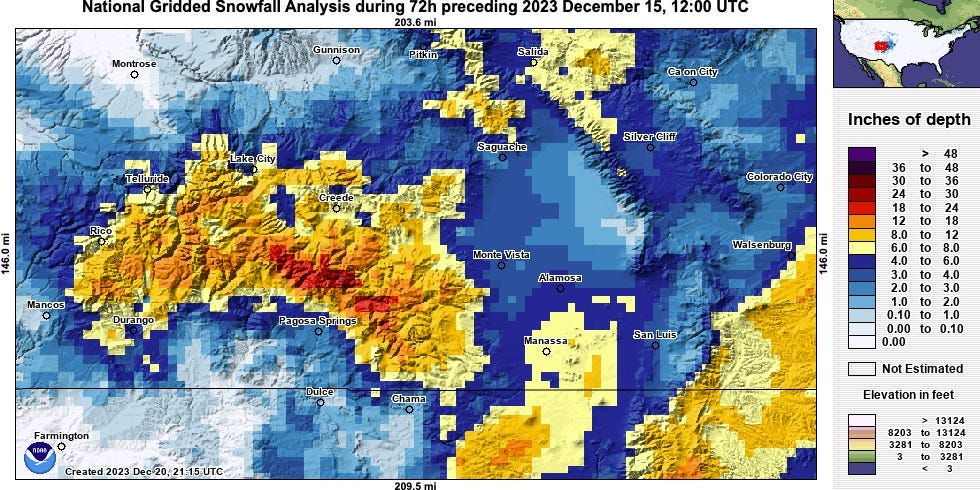
National Operational Hydrologic Remote Sensing Center
It’s a mouthful, but NOAA’s National Operational Hydrologic Remote Sensing Center is an essential source for snow data. NOHRSC’s interactive map offers a variety of snow-related data, including depth, temperature, density, and melting. You can also select data for any day since 2002. Below is an example of the snowfall during 72 hours in December 2023 in southern Colorado and northern New Mexico.
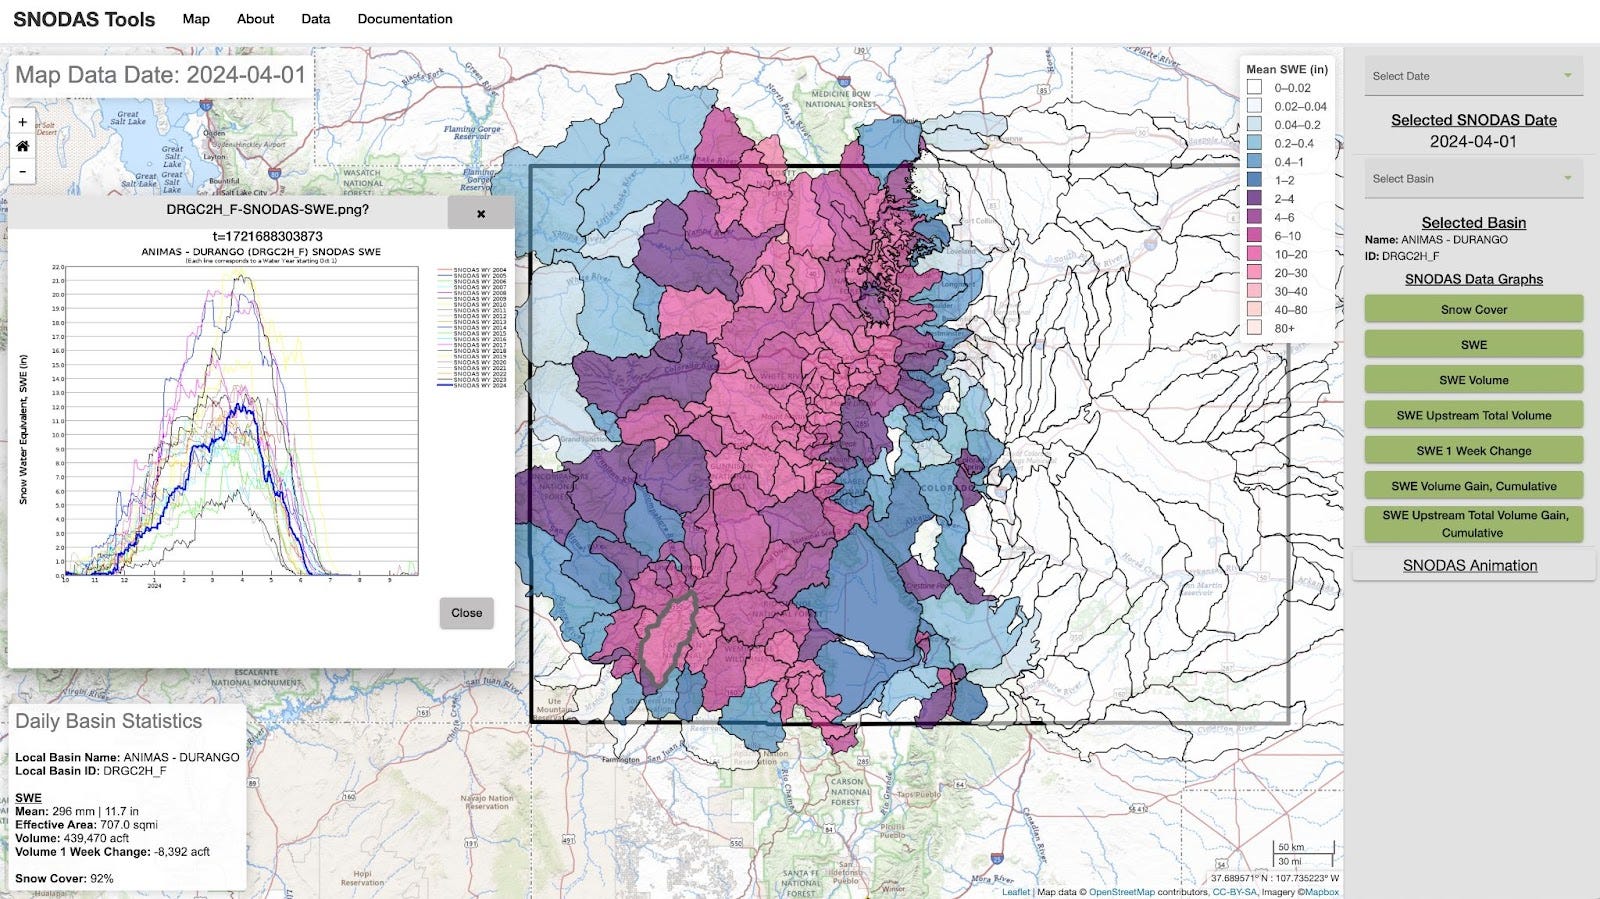
Colorado SNODAS
Colorado’s snowpack supplies water to 19 other states downstream. If you’re looking for a detailed view of snow conditions in the state, check out SNODAS, which uses data from NOHRSC, satellites, planes, and other sources to calculate daily SWE estimates for individual river basins. The project was funded by the Colorado Water Conservation Board and developed by the Open Water Foundation.
In the graphic below, I’ve highlighted the Animas River in southwest Colorado, which brings up a chart showing how the 2023/2024 compared to past seasons and provides a snapshot of conditions in the basin.
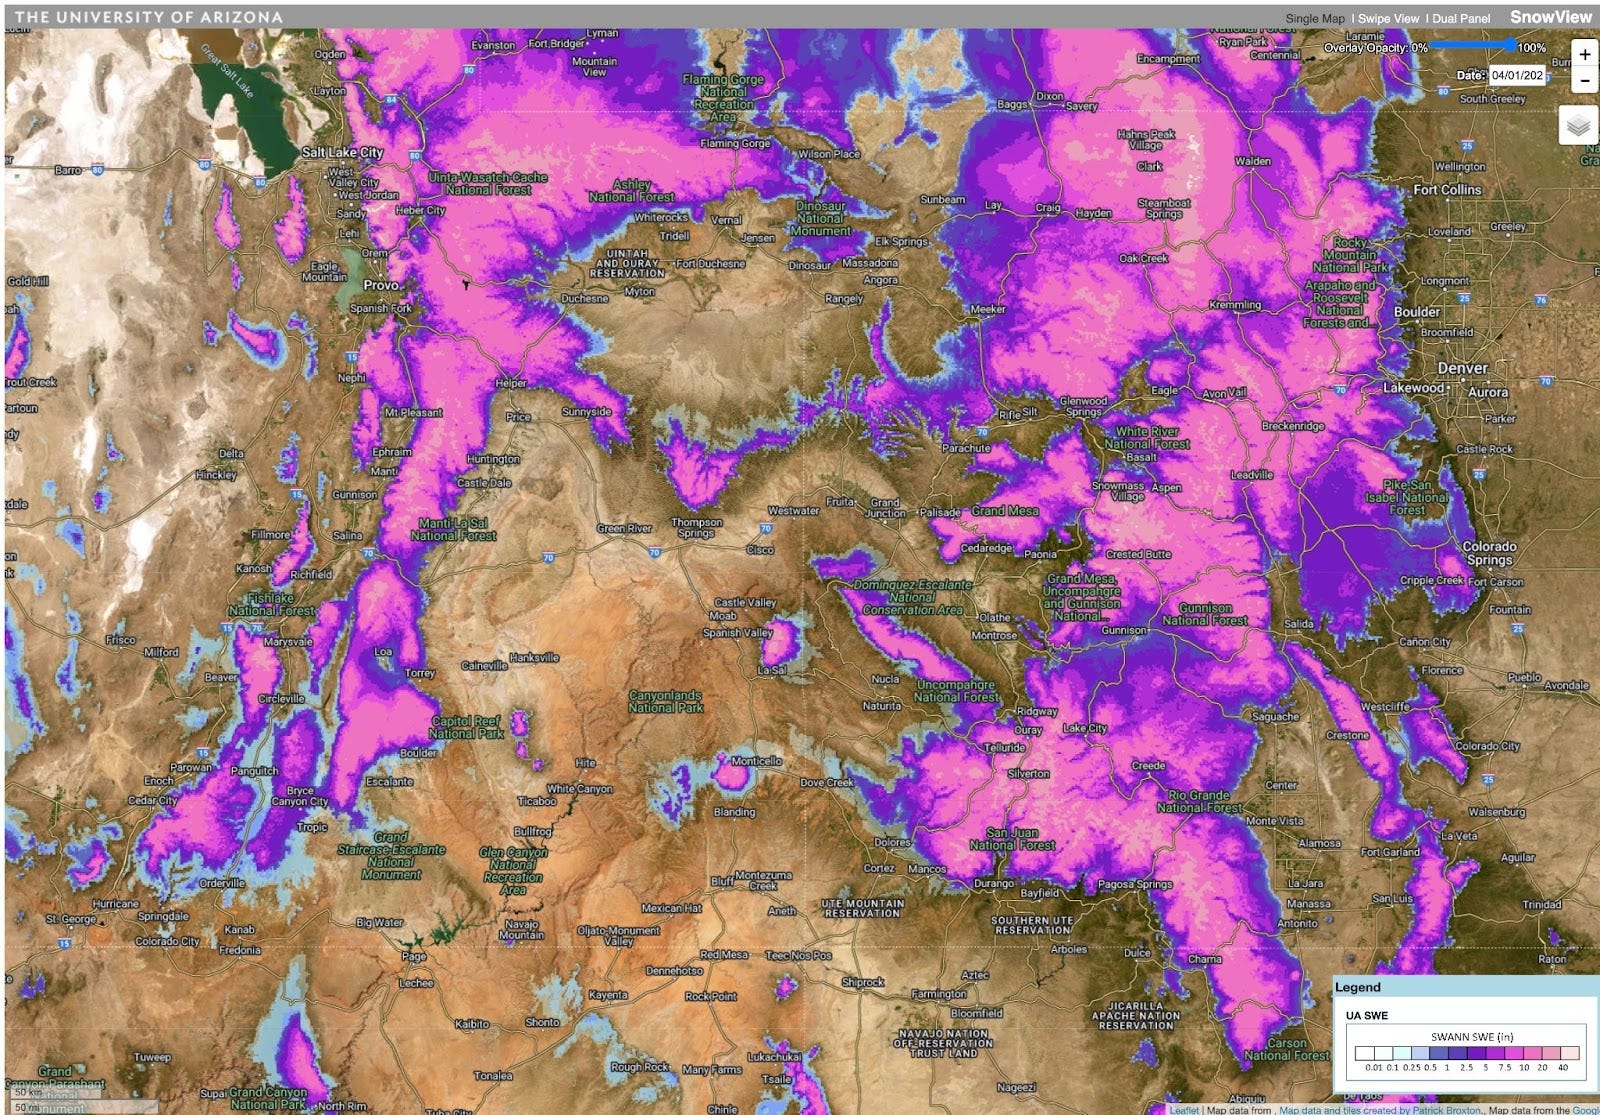
University of Arizona’s SWANN and SnowView
The University of Arizona’s Snow Water Artificial Neural Network Modeling System (SWANN) uses a variety of data and machine learning to generate near real-time estimates for SWE and snow cover across the entire nation. SWANN estimates are also available back to the early 1980s. The SnowView dashboard lets you explore data on the snowpack, snow cover, and precipitation while also providing satellite imagery and streamflow forecasts (more on the tool in this presentation). The April 1, 2024, map below shows the SWE estimates for the Intermountain West that were generated using SWANN.
Community Collaborative Rain, Hail and Snow Network (CoCoRaHS)
CoCoRaHS is a citizen-science effort that describes itself as “a unique, non-profit, community-based network of volunteers of all ages and backgrounds working together to measure and map precipitation (rain, hail and snow).”
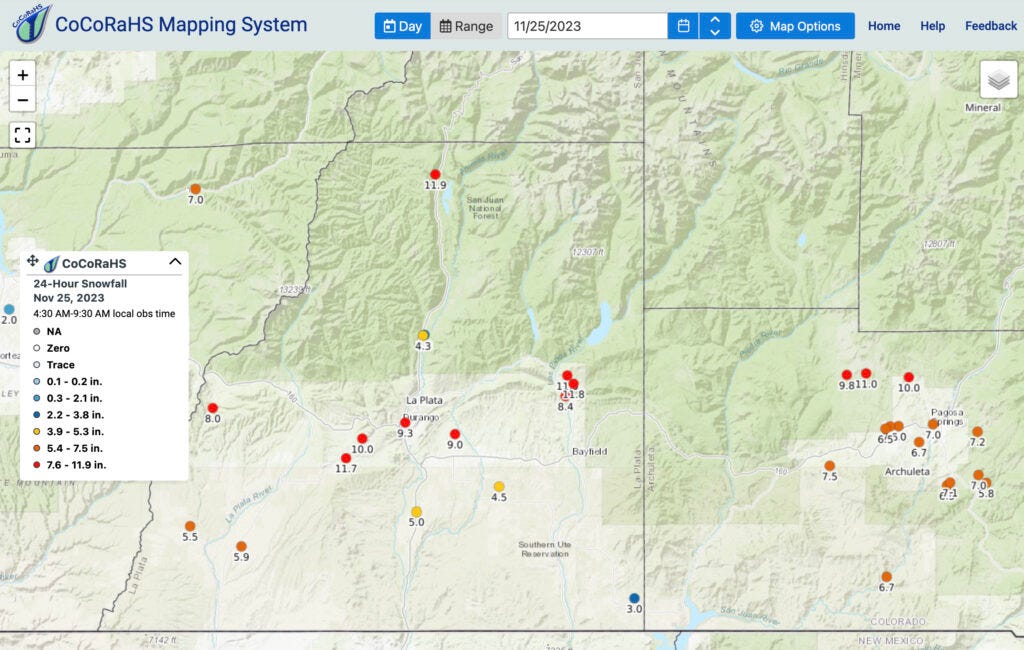
Measurements from volunteers are plotted on an interactive map that has data available back to 1998. The image below shows 24-hour snowfall around Durango and Pagosa Springs after a November 2023 storm.
As you’d expect, big cities have a lot more observations than rural areas. See this page for more about the project and how to sign up as a volunteer.
Data from CoCoRaHS is one of the inputs to this map from the National Centers for Environmental Information that tracks daily U.S. snowfall and snow depth.
Snow-related dashboards
Finally, several helpful websites aggregate data, maps, and graphics from various sources, offering a quick overview of what’s happening with snowfall and the snowpack.
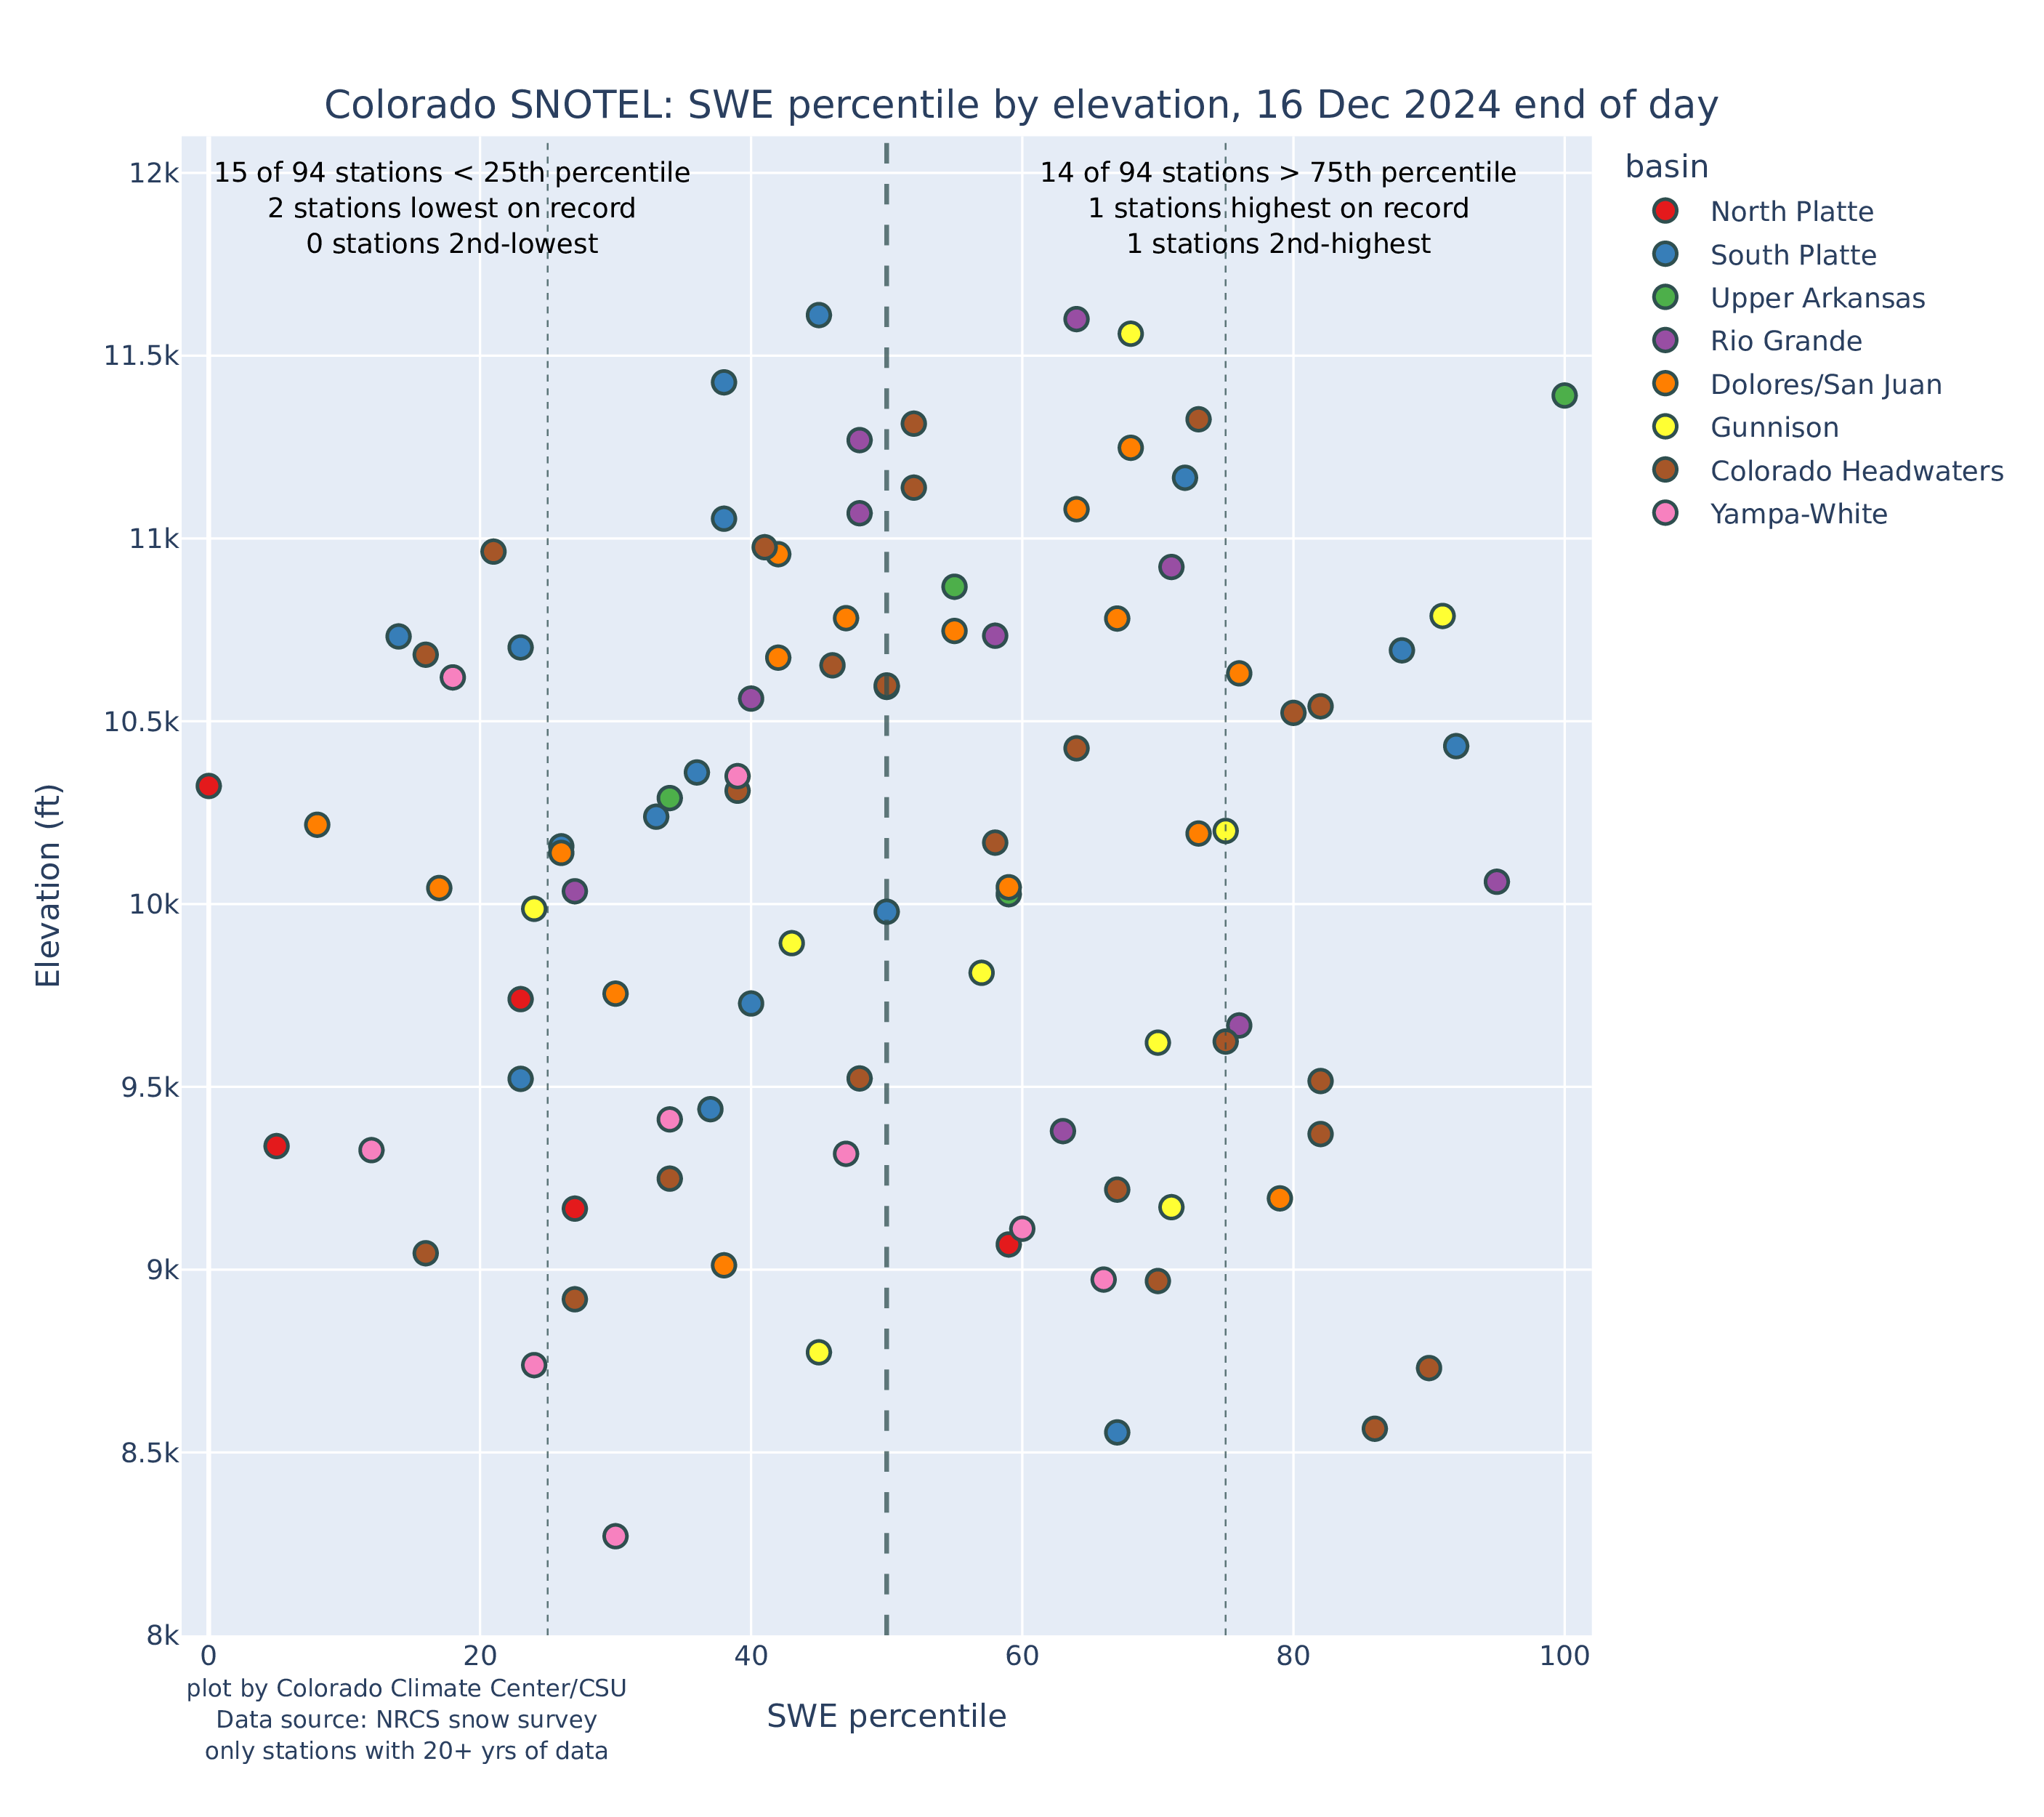
The Intermountain West Ski Dashboard, created by the Colorado Climate Center at Colorado State University, pulls together data on recent snowfall, short-term forecasts, weather hazards, snow depth, drought, and more. Below is an example of a graphic showing the status of 94 SNOTEL sites in Colorado on December 16. The dotted vertical line in the middle is the 50th percentile, with the vertical axis showing elevation and the colors corresponding to different river basins.
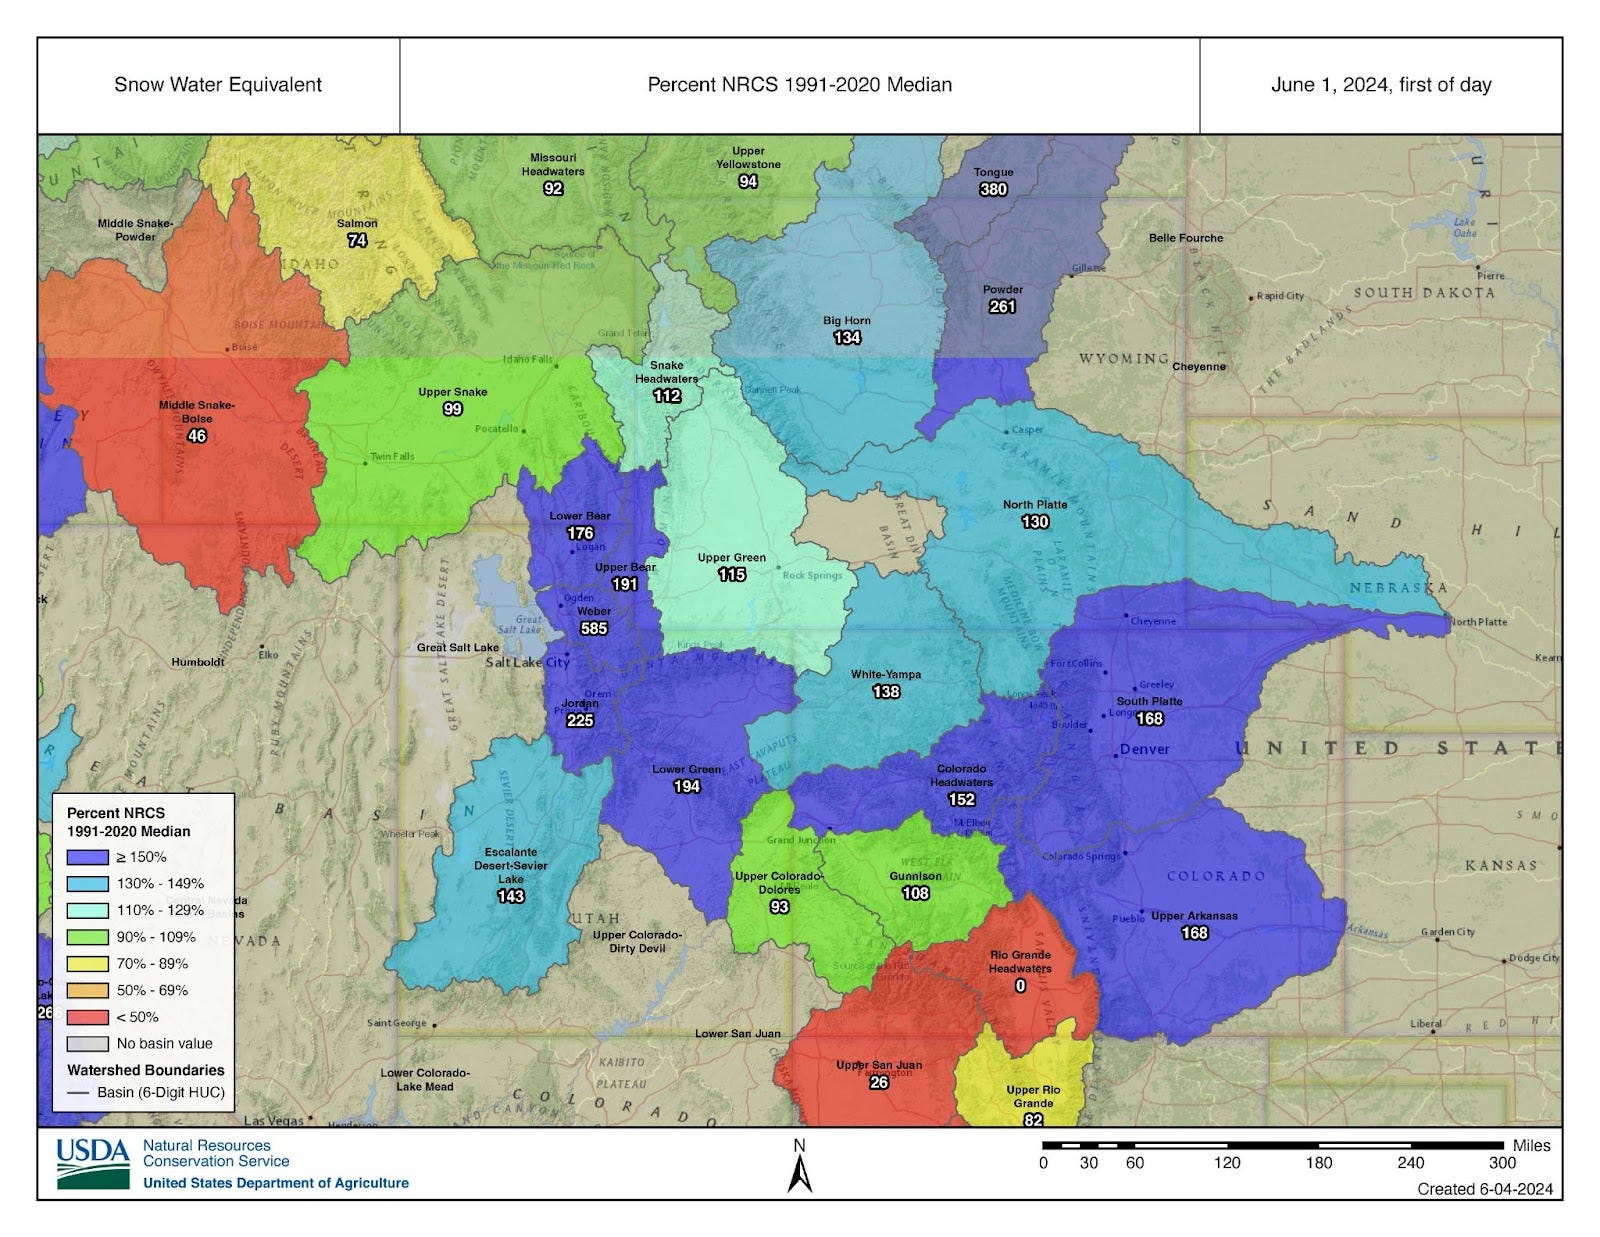
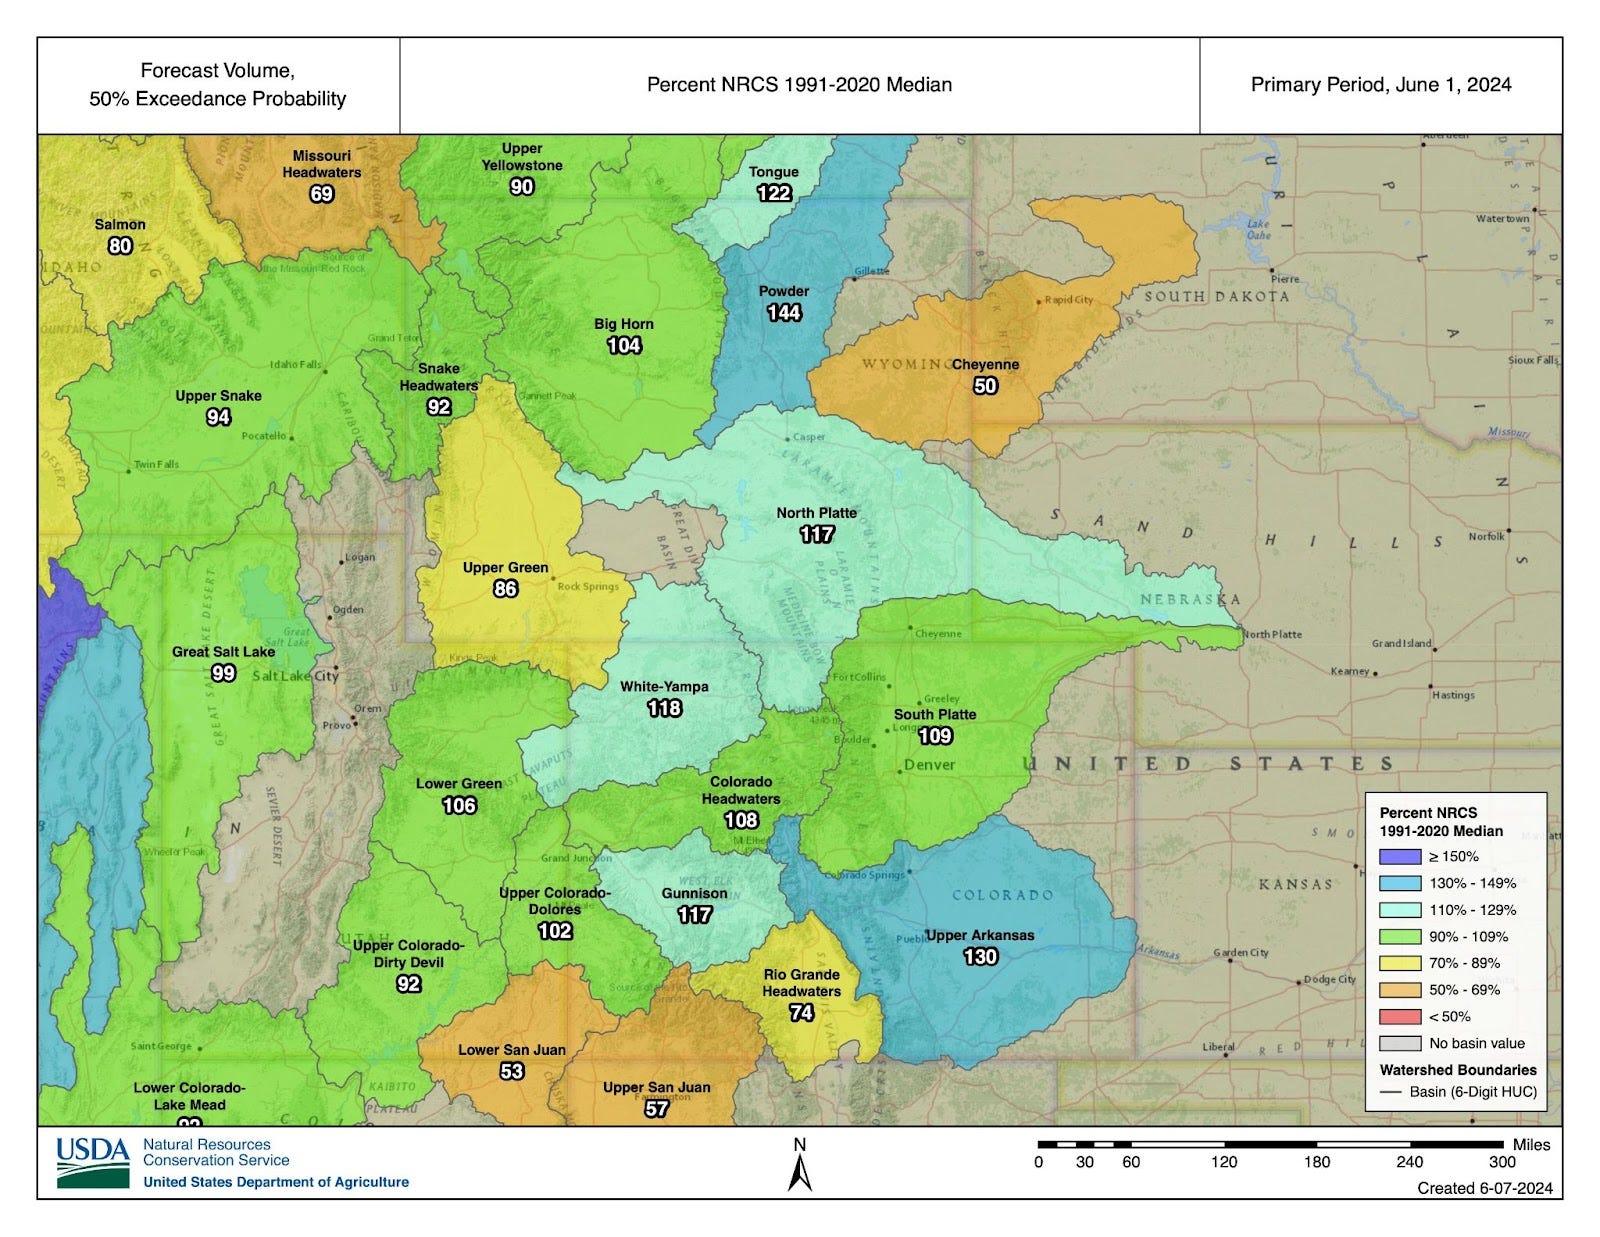
The Intermountain West Climate Dashboard, created by the Western Water Assessment at the University of Colorado Boulder, is another useful roundup that focuses on Colorado, Utah, and Wyoming. For example, the graphics below from the dashboard show SWE and projected June 1, 2024, streamflows in the Intermountain region.
Please feel free to suggest additions to this cheat sheet by emailing me.