How industrial emissions promote local snowfall
Plus: C is for "cryosphere" and an update on the West's snowpack

I’m no fan of industrial pollution, but a new study has concluded that smokestack emissions at high latitudes can promote plumes of local snowfall by supplying the nuclei around which snowflakes form.
If you’re a die-hard snow lover, maybe it’s time to ensconce yourself downwind from a factory or power plant so you can watch the extra flakes fly, perhaps while donning an industrial-grade air mask.
“Pollution boosts snowfall” may sound like Orwellian doublespeak emanating from a PR firm or rogue agency, but the findings make scientific sense once you remember that the prerequisites for snow are not only enough moisture and cold temperatures but also the airborne particles that serve as the germ for snow crystals. (Deliberately supplying more of these particles is the essence of “cloud seeding.”)
The new study focused on supercooled liquid-water clouds and looked at 67 hotspots for aerosol emissions in North America, Europe, and Asia, including cement factories, metal plants, coal-fired power stations, oil refineries, and paper mills. The study was published in the November 14 issue of the journal Science and was authored by a global team of 19 researchers.
“This is the first direct evidence of industrial pollution causing the water in clouds to freeze and fall to earth as snow,” said co-author Duncan Watson-Parris, an atmospheric physicist at UC San Diego’s Scripps Institution of Oceanography and the Halıcıoğlu Data Science Institute, in a press release. “Our findings show something that could be an important missing piece from climate models and a clear place to look for future studies.”
The figure below from the paper explains the process: aerosols, which are tiny air pollution particles, cause ice crystals to precipitate out of the clouds, though it’s possible that heat and water vapor from the hotspots also contribute.
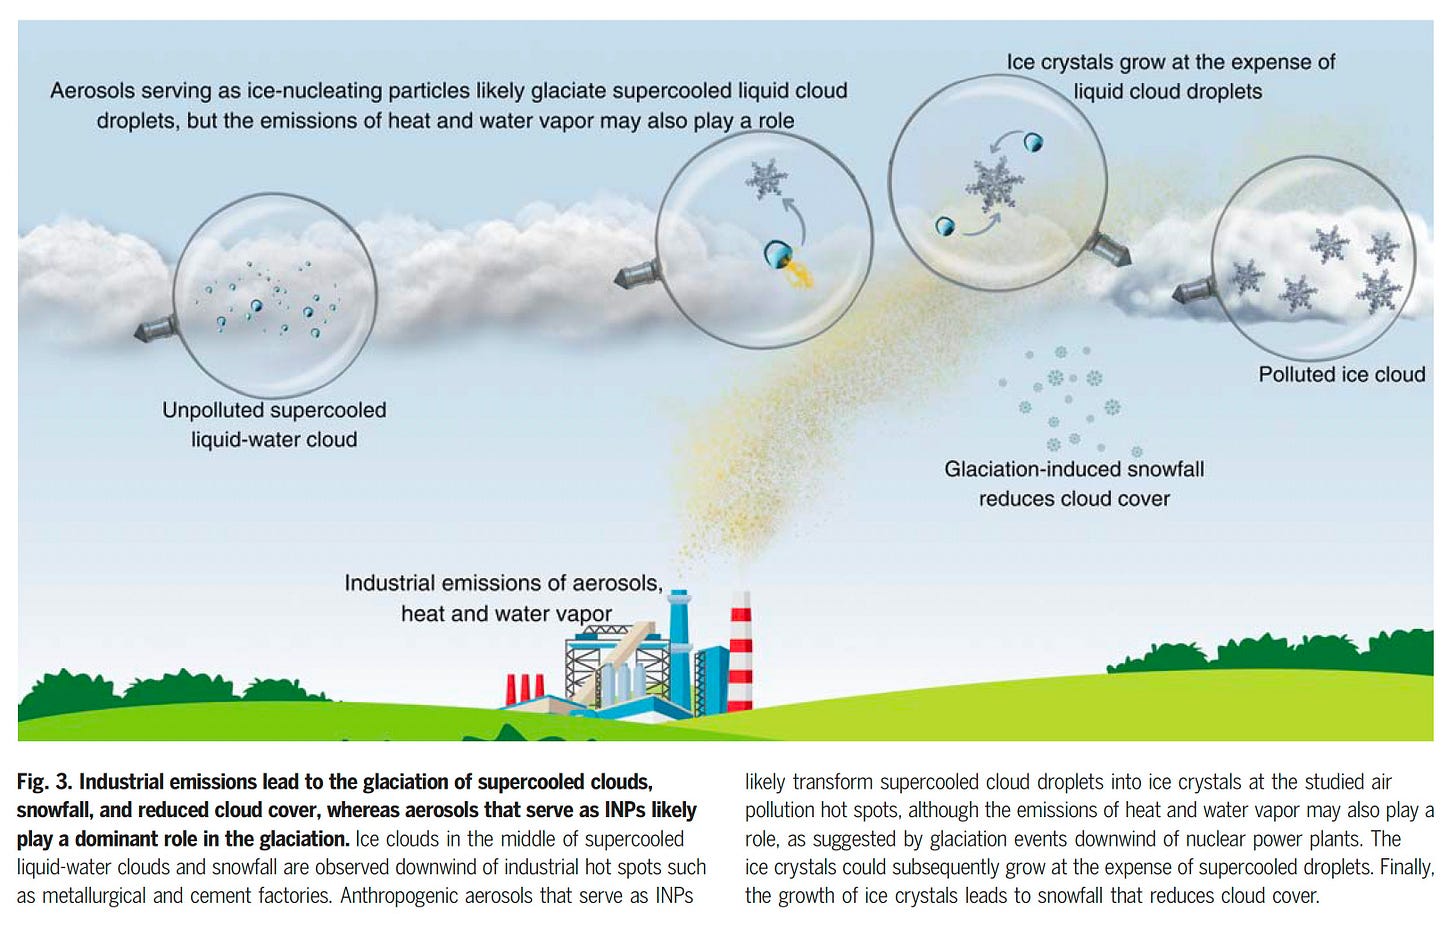
The study also found “relatively rare” downwind effects around some nuclear power plants that emit little to no aerosols but do give off heat and water vapor, with the scientists writing that “buoyant plumes” from those nukes might lift nearby aerosols and promote snowfall.
As the pollution spurred snowfall, the researchers could document the precipitation with radar while also using satellite imagery to capture the resulting reduction in cloud cover as the moisture fell to the ground, as shown in the graphic below.
The plumes of snow covered an average of 834 square miles, with the cloud perturbations extending nearly double that range. These “glaciation events” led to daily snowfall of 15 mm, or 0.6 inches.
By decreasing cloud cover, the aerosols can exert a warming effect by reducing the reflection of sunlight, so while the pollution may boost snowfall locally, the process writ large isn’t good news for snow.
And the very types of hotspots studied in this paper include some of the biggest emitters of greenhouse gases, which are causing global warming and threatening the Earth’s cryosphere . . .
SnowSlang: C is for “cryosphere”
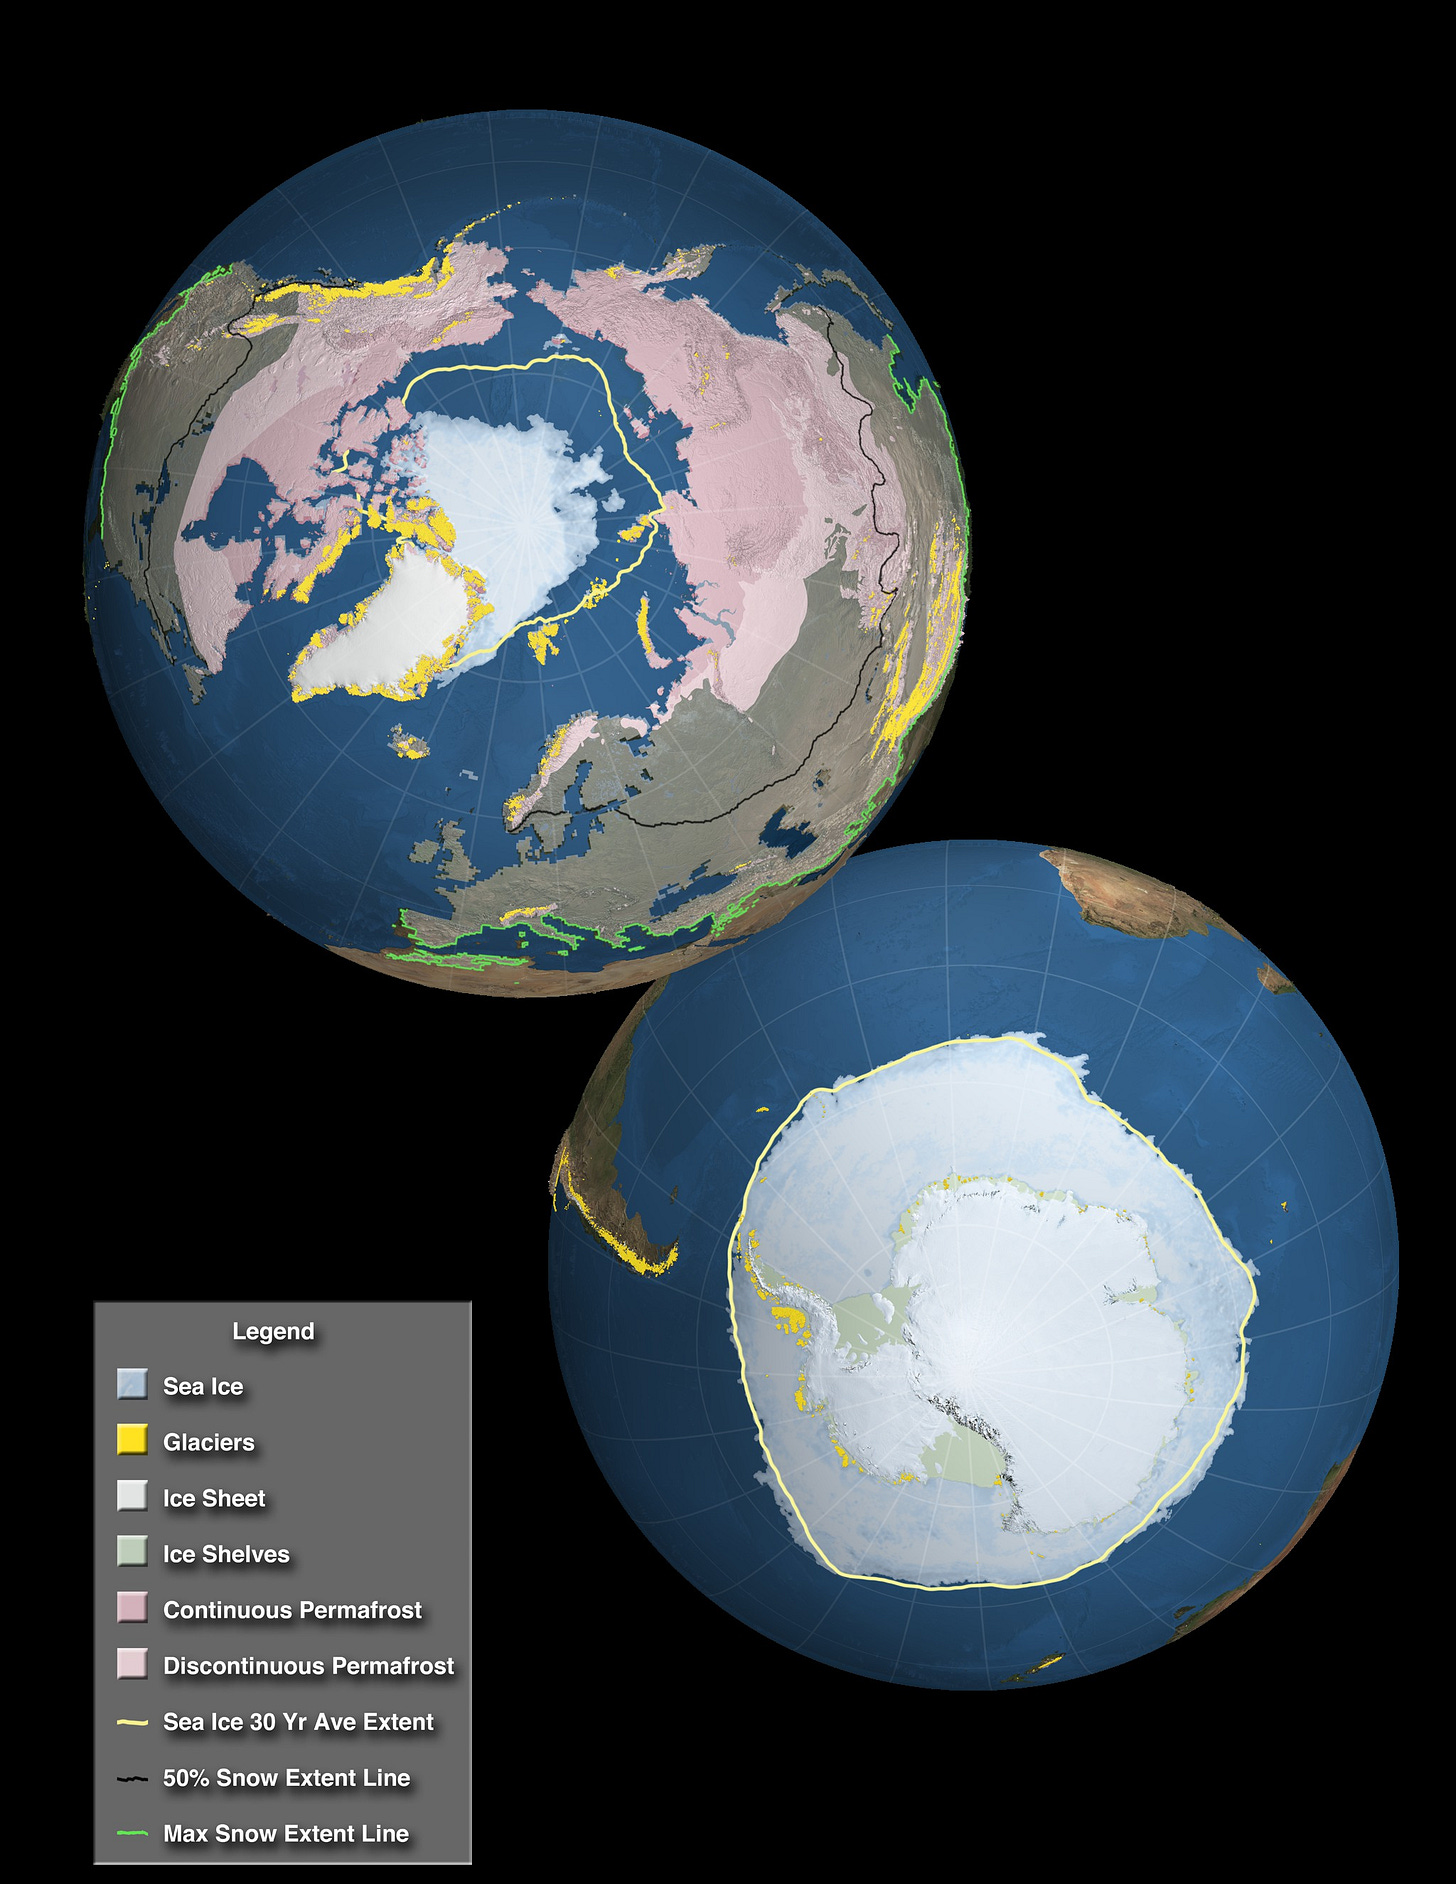
The cryosphere encompasses all the frozen parts of Earth’s surface: snow cover, glaciers, permafrost, sea ice, ice sheets, ice shelves, icebergs, and river/lake ice.
In the American West and beyond, the cryosphere is a critical source of freshwater, while on the global scale, the cryosphere plays a key role in regulating the planet’s climate by reflecting sunlight (see previous post on albedo). The term derives from the Greek word kryos, meaning “cold” or “frost.”
At snow.news, I’m only covering a piece of the cryosphere—snow cover, with a dash of glaciers and permafrost—but the illustration below shows the cryosphere’s many other components. Sadly, I’ve never laid eyes on sea ice, an ice shelf, or an ice sheet, but maybe I’ll get there one day . . .

Here’s a nice overview from NASA’s Scientific Visualization Studio showing images of the cryosphere from above the poles.
The map below offers another interesting view of the cryosphere, using a Dymaxion projection, which was created by the visionary inventor Buckminster Fuller and looks fit for origami. Antarctica is on the left, and the North Pole is in the middle of the visualization.

Nearly all of the Earth’s snow-covered areas are located in the Northern Hemisphere, and this component of the cryosphere ranges in size from 47 million square kilometers in winter to just 7 million square kilometers in summer, as shown in the graphic below. At its winter maximum, snow covers about one-half of the Northern Hemisphere’s land mass, which speaks to its significance, at least for part of the year.
“The areal extent of snow varies more rapidly and more dramatically than that of any other widely distributed material on Earth,” write Olav Slaymaker and Richard E.J. Kelly in The Cryosphere and Global Environmental Change, the data source for the graphic above.
The chart below, which is based on data from The Global Cryosphere: Past, Present and Future by Roger Barry and Thian Yew Gan, breaks down the components into four categories: snow cover, sea ice, permafrost, and ice. This graphic shows the relative sizes of the cryosphere’s components, with the time of year listed for the seasonal elements (i.e., all of these areas don’t appear on Earth at the same time).
Climate change is already taking a toll on the cryosphere, with warming rates much higher around the poles and even more drastic reductions for snow/ice projected in the decades ahead. For a solid overview of the global impacts, see the Intergovernmental Panel on Climate Change’s “Special Report on the Ocean and Cryosphere in a Changing Climate.” Another good source is the State of the Cryosphere Report published annually by the International Cryosphere Climate Initiative.
Snowpack update
An atmospheric river and a pair of bomb cyclones are pummeling the West Coast this week. One of the bomb cyclones is “among the strongest on record,” according to meteorologist Judson Jones at The New York Times. The animation below from this morning shows a visualization of the winds.

The map below, from the Center For Western Weather and Water Extremes, shows that some coastal locations face Category 4 conditions on the Atmospheric River Scale.
The storminess will add to an already impressive early-season snowpack in the Pacific Northwest, as shown by the map below. Lagging behind are Wyoming and parts of Montana, Utah, and Colorado.
First runs of the season
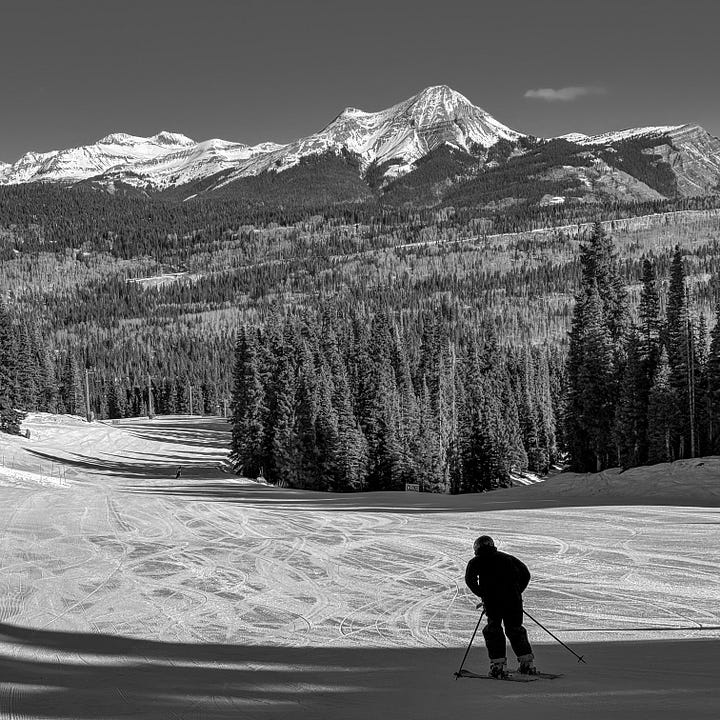
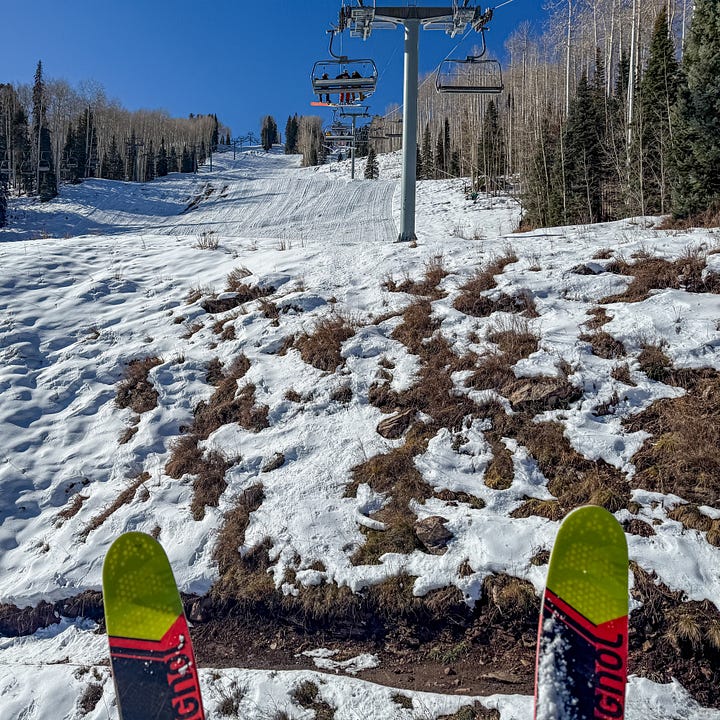
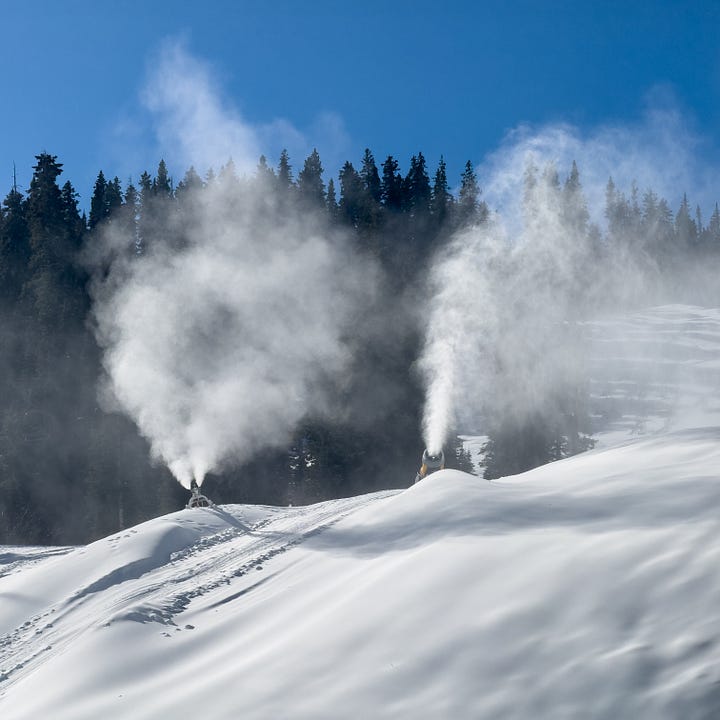
A smile slid across my face as soon as I started gliding down my first run of the season at Purgatory on Sunday. Thanks to some early-season storms and a major assist from snowmaking, there were a couple of blue and green runs open from top to bottom.
Like any self-respecting ski bum, I’m all about face shots in blower pow, but I learned long ago that ripping corduroy on a groomer under bluebird skies can also do wonders for my mood and outlook.
