Snowpack update and E is for "ENSO"
Late December storms boosted the snowpack in parts of the West, but drought is expected to expand in southern areas

The snowpack was flatlining during December in many parts of the American West, but the month ended on an upbeat note. A series of storms brought precipitation to the northern and central portions of the region—but no drought relief to the south.
The January 1 map below shows the status of the snowpack, with the colors shaded according to percent of the long-term median (1991-2020). The Pacific Northwest generally has done well, while the mountains of Arizona and New Mexico have seen little snow.

The graphic below shows the 14-day accumulation of snowfall from December 18 through December 31.

Conditions were grim in Wyoming earlier in December before storms at the end of the month gave a boost to the black line below—but only to the 11th percentile for January 1 and 81% of the 30-year median.

Arizona continues to suffer from a meager snowpack, with the January 1 chart below showing the statewide total at 23% of normal. The state’s median peak date is March 3, so there are only a couple of months to turn things around.

In California, there’s a sharp divide from north to south in the Sierra Nevada. The January 2 graphic below shows that the snowpack was 161% of normal in the north but just 75% of normal in the south.

In my previous post, I offered a cheat sheet for monitoring the snowpack, and I continue to come across new sources of interesting data visualizations. My latest find is the Climate Toolbox’s Climate Mapper. The image below shows the precipitation anomaly since October 1, the start of the current water year.

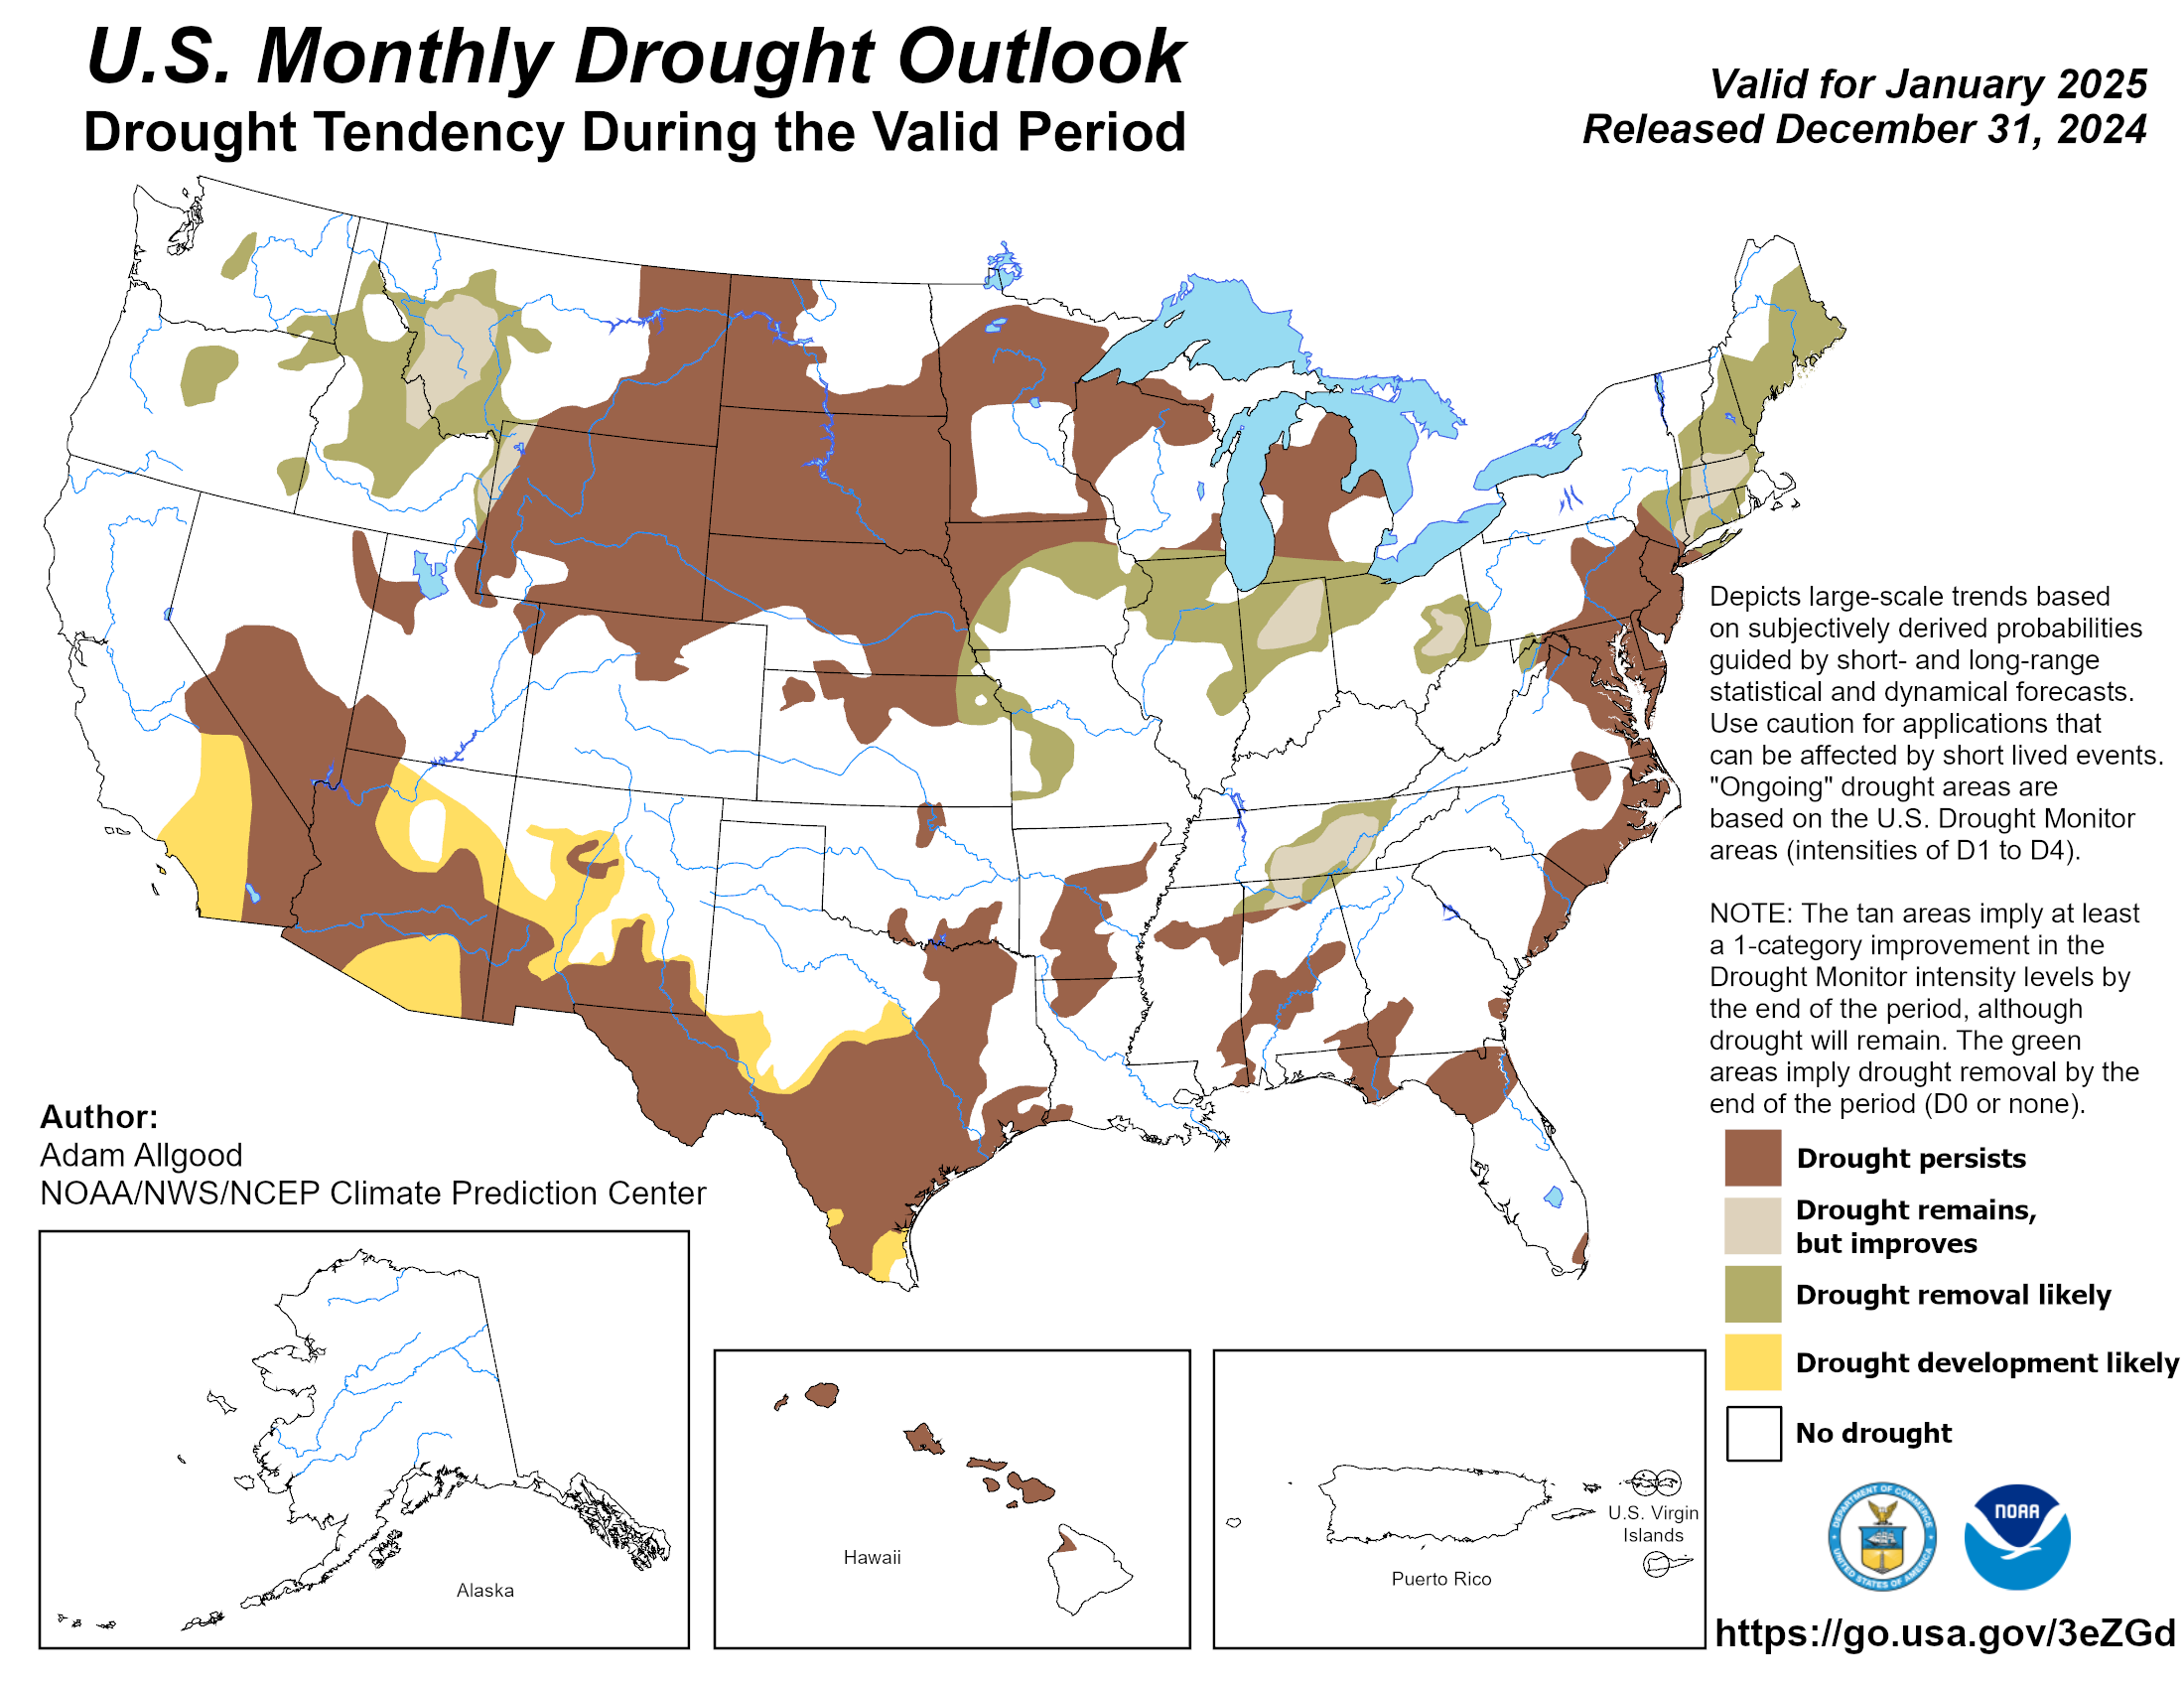
The latest outlook from the Climate Prediction Center calls for drought to expand its reach in Southern California, Arizona, New Mexico, and Texas.
To some extent, the wetter conditions in the Pacific Northwest and drier weather in the desert Southwest are in line with the pattern we might expect from La Niña, which brings me to the latest installment of . . .
SnowSlang: E is for “ENSO”
ENSO stands for El Niño-Southern Oscillation, a climate phenomenon in which changing sea surface temperatures and atmospheric pressure patterns in the equatorial Pacific Ocean can exert significant influences on weather around the world.
ENSO has three phases:
1. El Niño: when sea-surface temperatures in the central and eastern Pacific are warmer than average. The typical trade winds, which blow from east to west, tend to weaken or even reverse into westerlies.
2. La Niña: when sea-surface temperatures in the central and eastern Pacific are cooler than average. In this case, the normal easterly trade winds tend to strengthen.
3. Neutral: when sea-surface temperatures are close to average, though as NOAA notes, “there are some instances when the ocean can look like it is in an El Niño or La Niña state, but the atmosphere is not playing along (or vice versa).”
The graphic below from NOAA shows the anomalies in sea-surface temperatures during the two opposing phases.
 and El Niño (bottom)")
The maps below, from NOAA’s National Ocean Service, show the typical weather patterns during El Niño (top) and La Niña (bottom), though these aren’t set in stone.


Here’s a helpful video from the National Ocean Service showing how ENSO works:
The name “El Niño” in this context is Spanish for “the Christ child.” In the 17th century, South American fishermen noticed the pattern peaking around Christmas. During El Niño, the unusually warm waters off the west coast of Ecuador and Peru diminished their catch by disrupting the upwelling of nutrient-rich cold water.
The “Southern Oscillation” in the ENSO acronym refers to changing patterns in sea-level pressure in Indonesia and the tropical Pacific that were discovered in the early 20th century by Sir Gilbert Walker, an English physicist, mathematician, meteorologist, and namesake of the Walker Circulation.
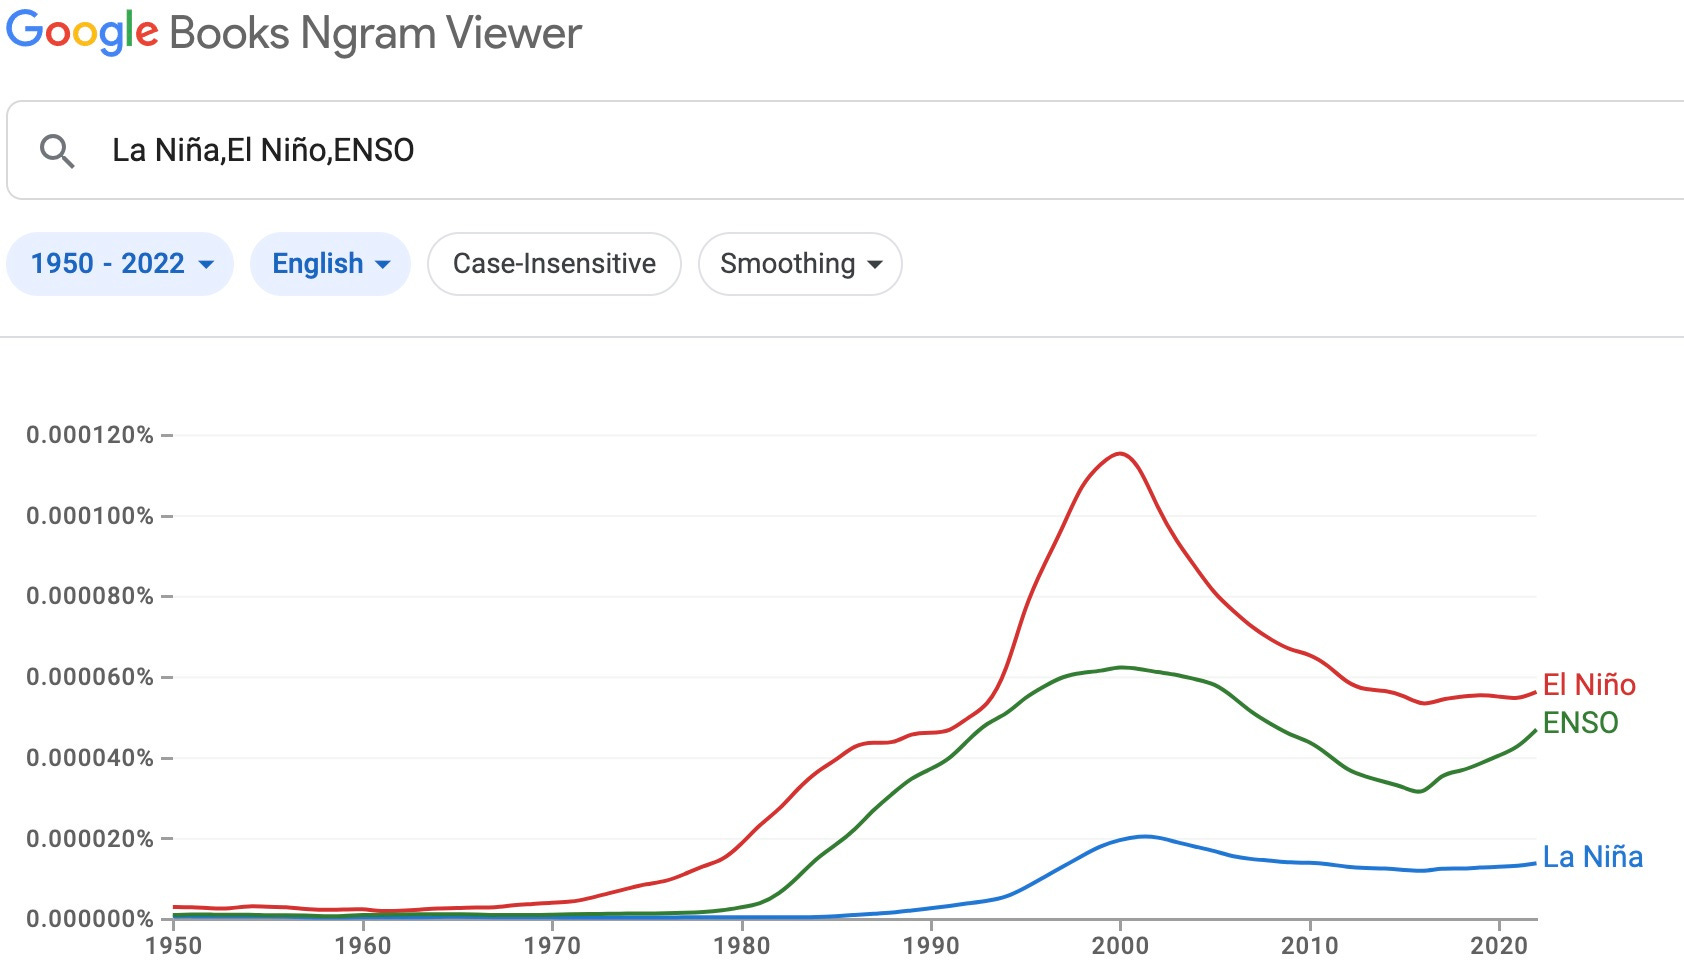
Eventually, scientists linked the changes in sea-surface temperatures with the atmospheric patterns, but it wasn’t until the 1980s that the terms El Niño, La Niña, and ENSO took off, as shown in the chart below from Google Books Ngram Viewer, which tracks word usage.
According to the latest report from the Climate Prediction Center, we’re currently in a La Niña Watch, with a shift to neutral conditions likely in the spring. It’ll be interesting to see what’s in the next update on January 9.
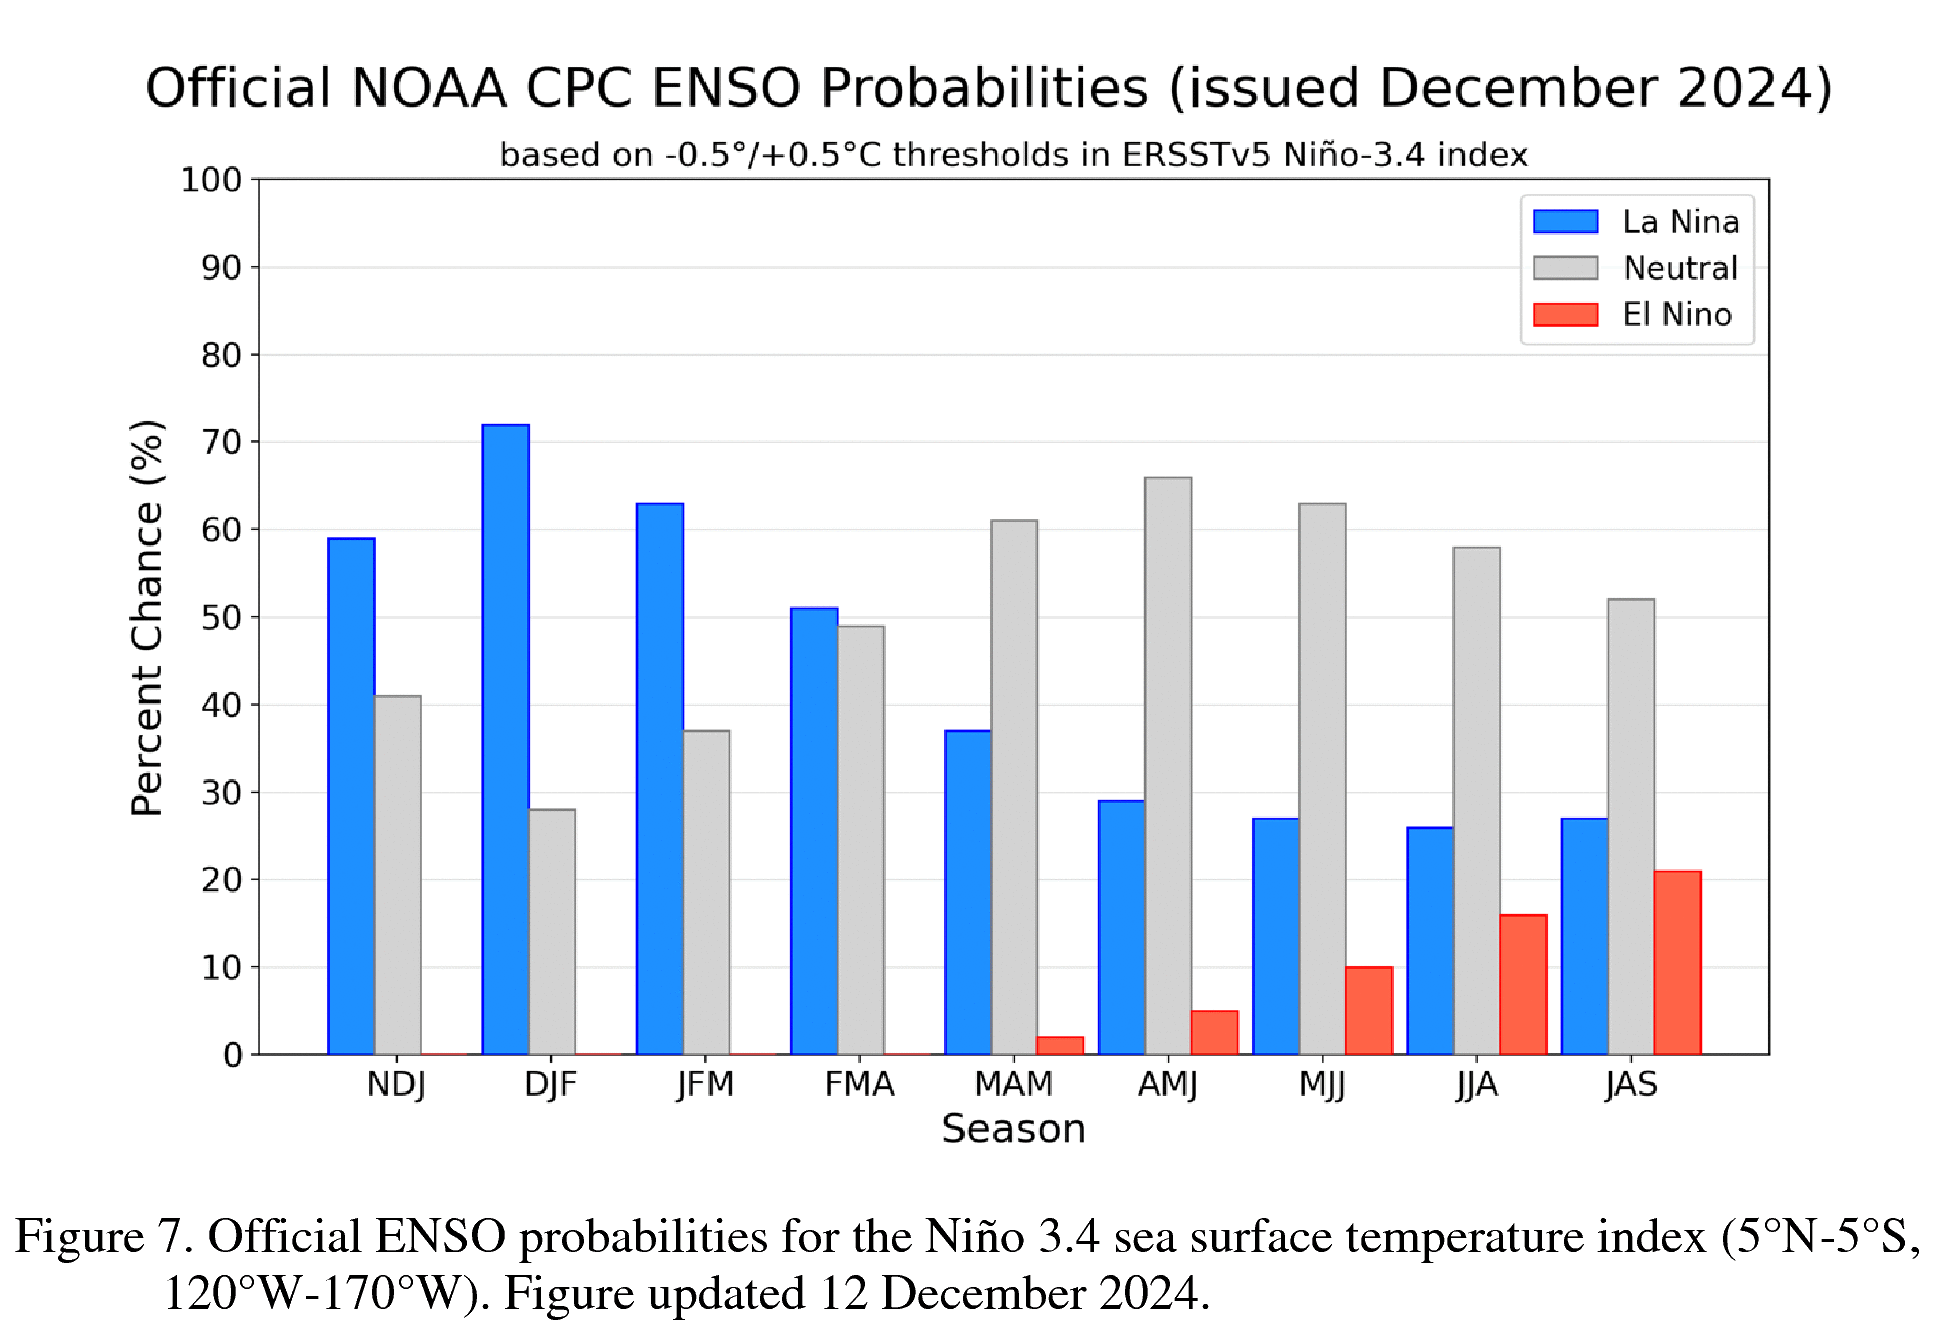
“The atmosphere looks like La Niña, and has for a while, but the ocean doesn’t, at least by our traditional sea surface temperature measures,” according to a December 12 post on climate.gov’s ENSO blog. “But even if we do declare a La Niña Advisory soon, it will very likely be a weak event at most.”
What does a weak La Niña mean for snowfall in the American West?
“In the nine previous weak La Niña events, the pattern of snow was similar to that of all La Niña events with above-average snowfall observed, on-average, across the northwest and north central U.S. with below-average snowfall farther south,” according to an October 24 post on the ENSO blog, which includes the map below for January-March snowfall.

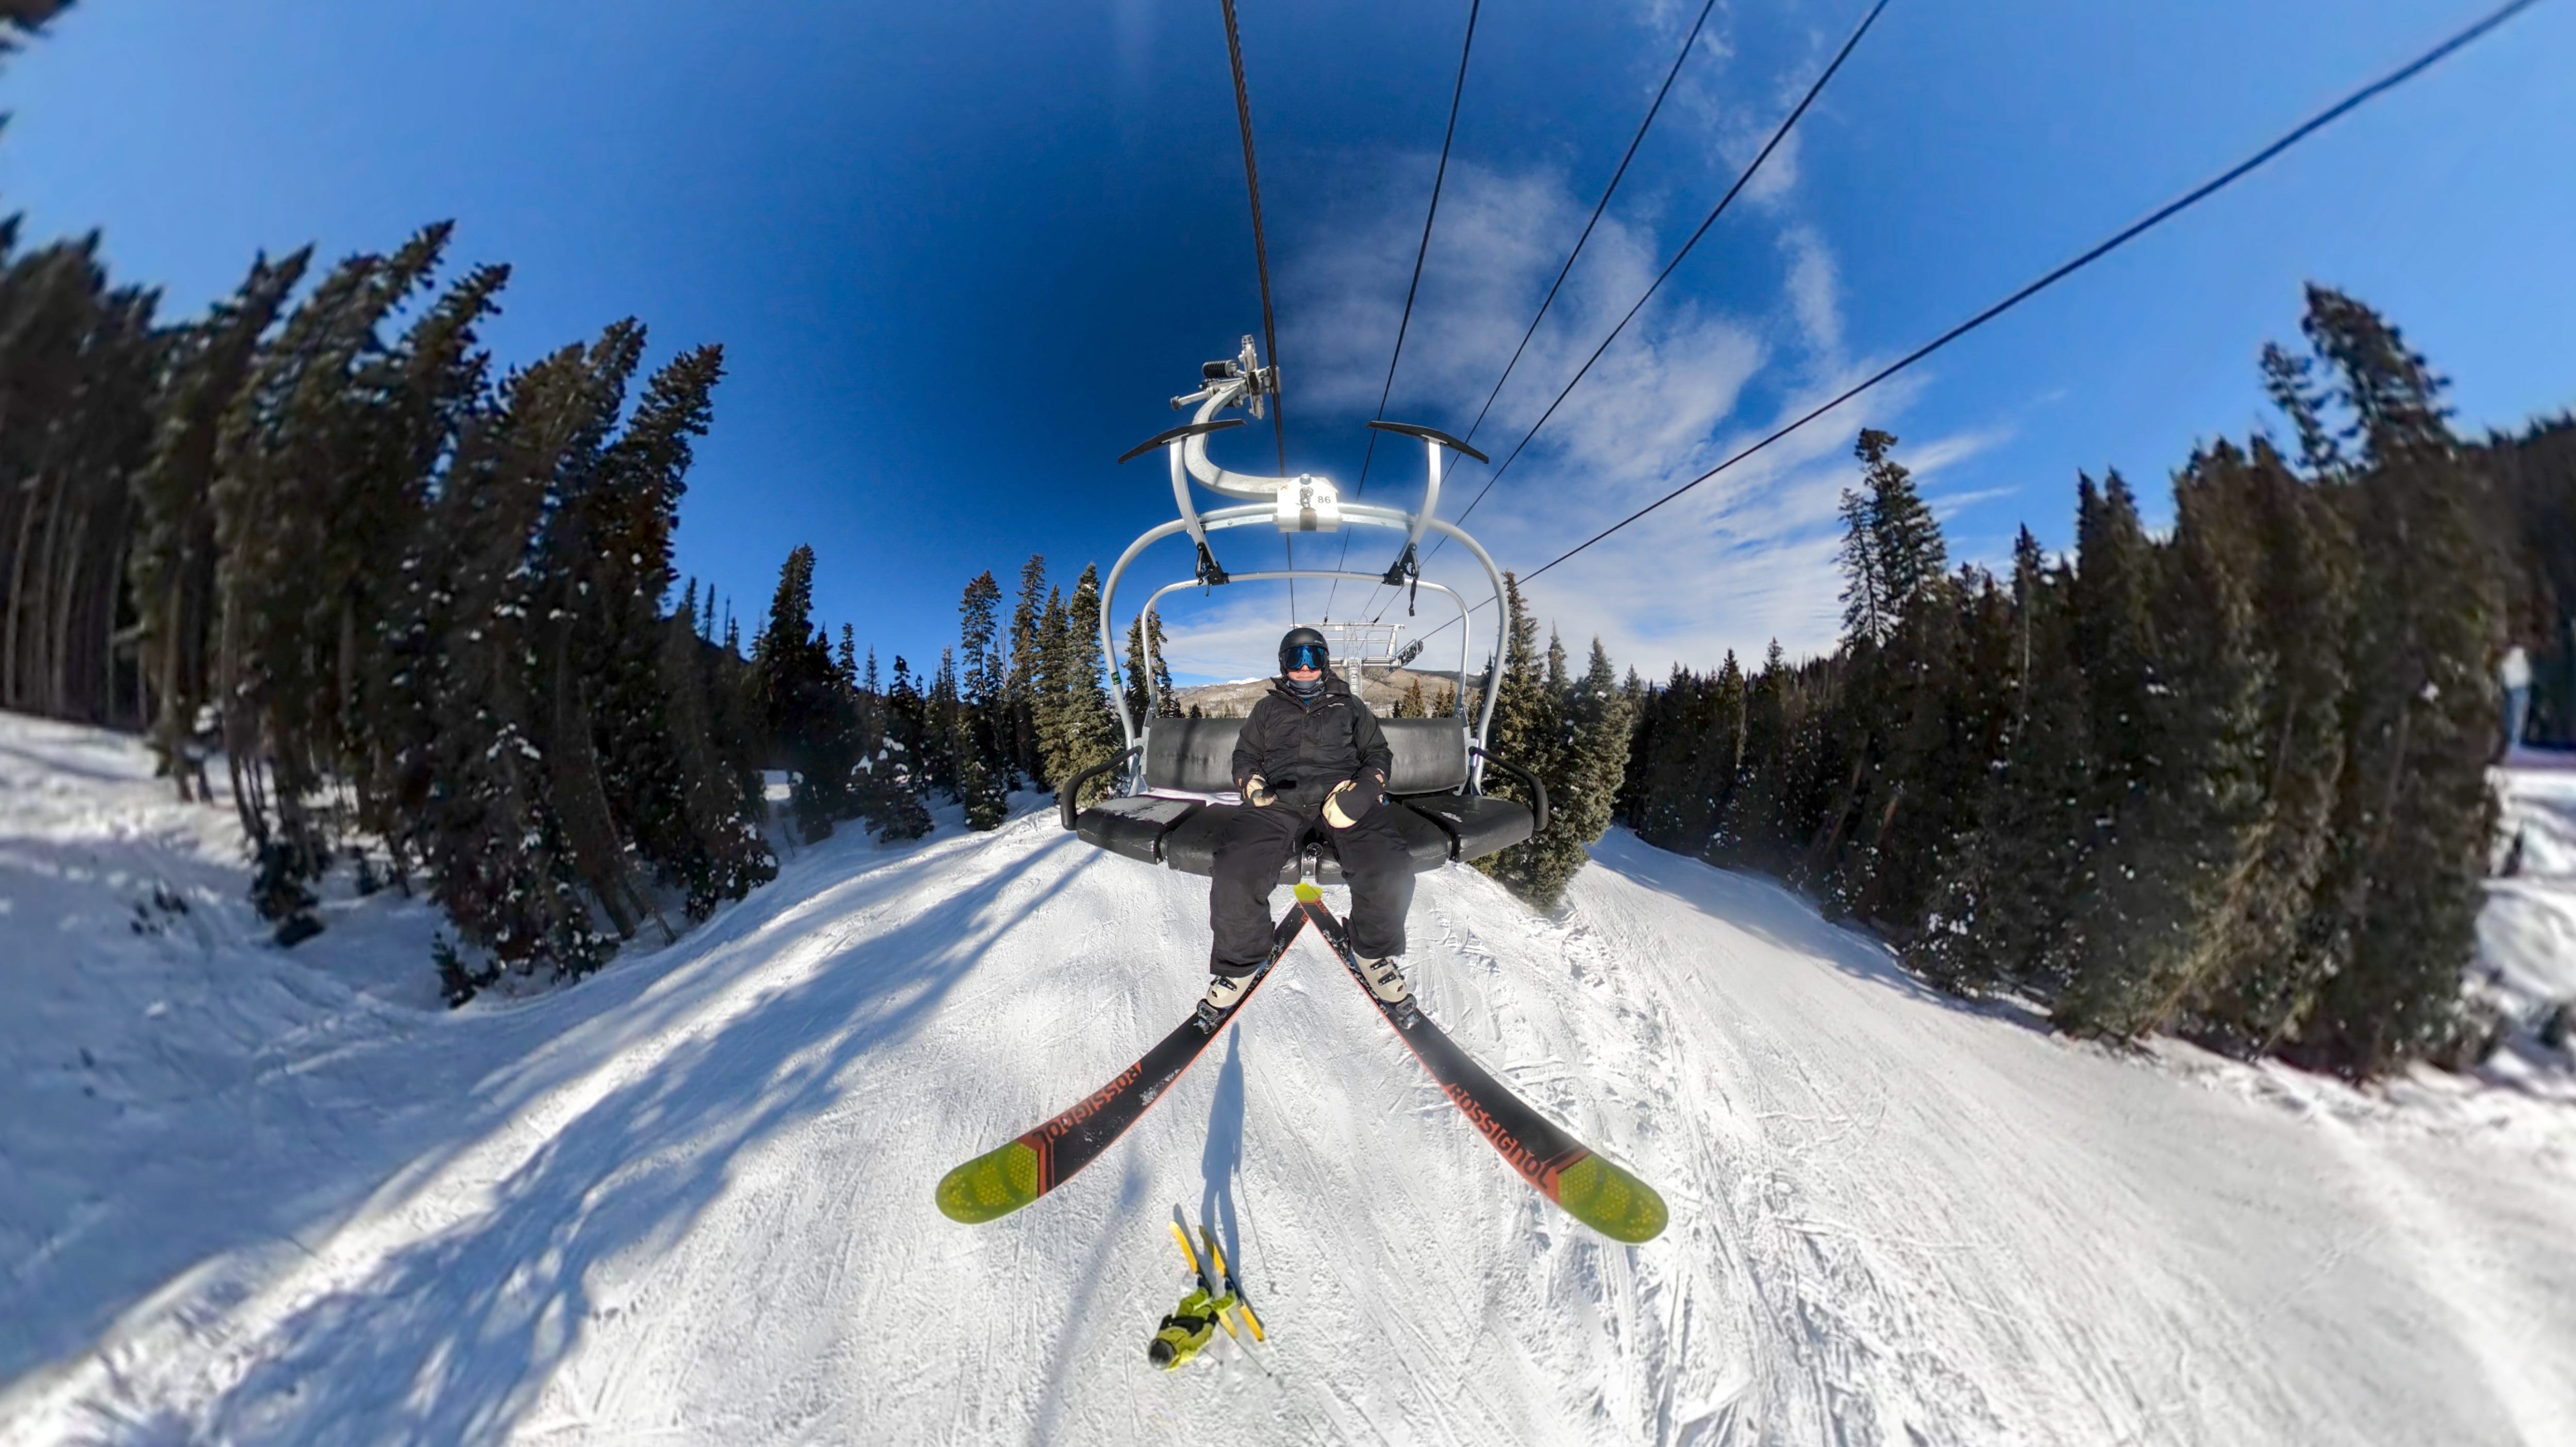
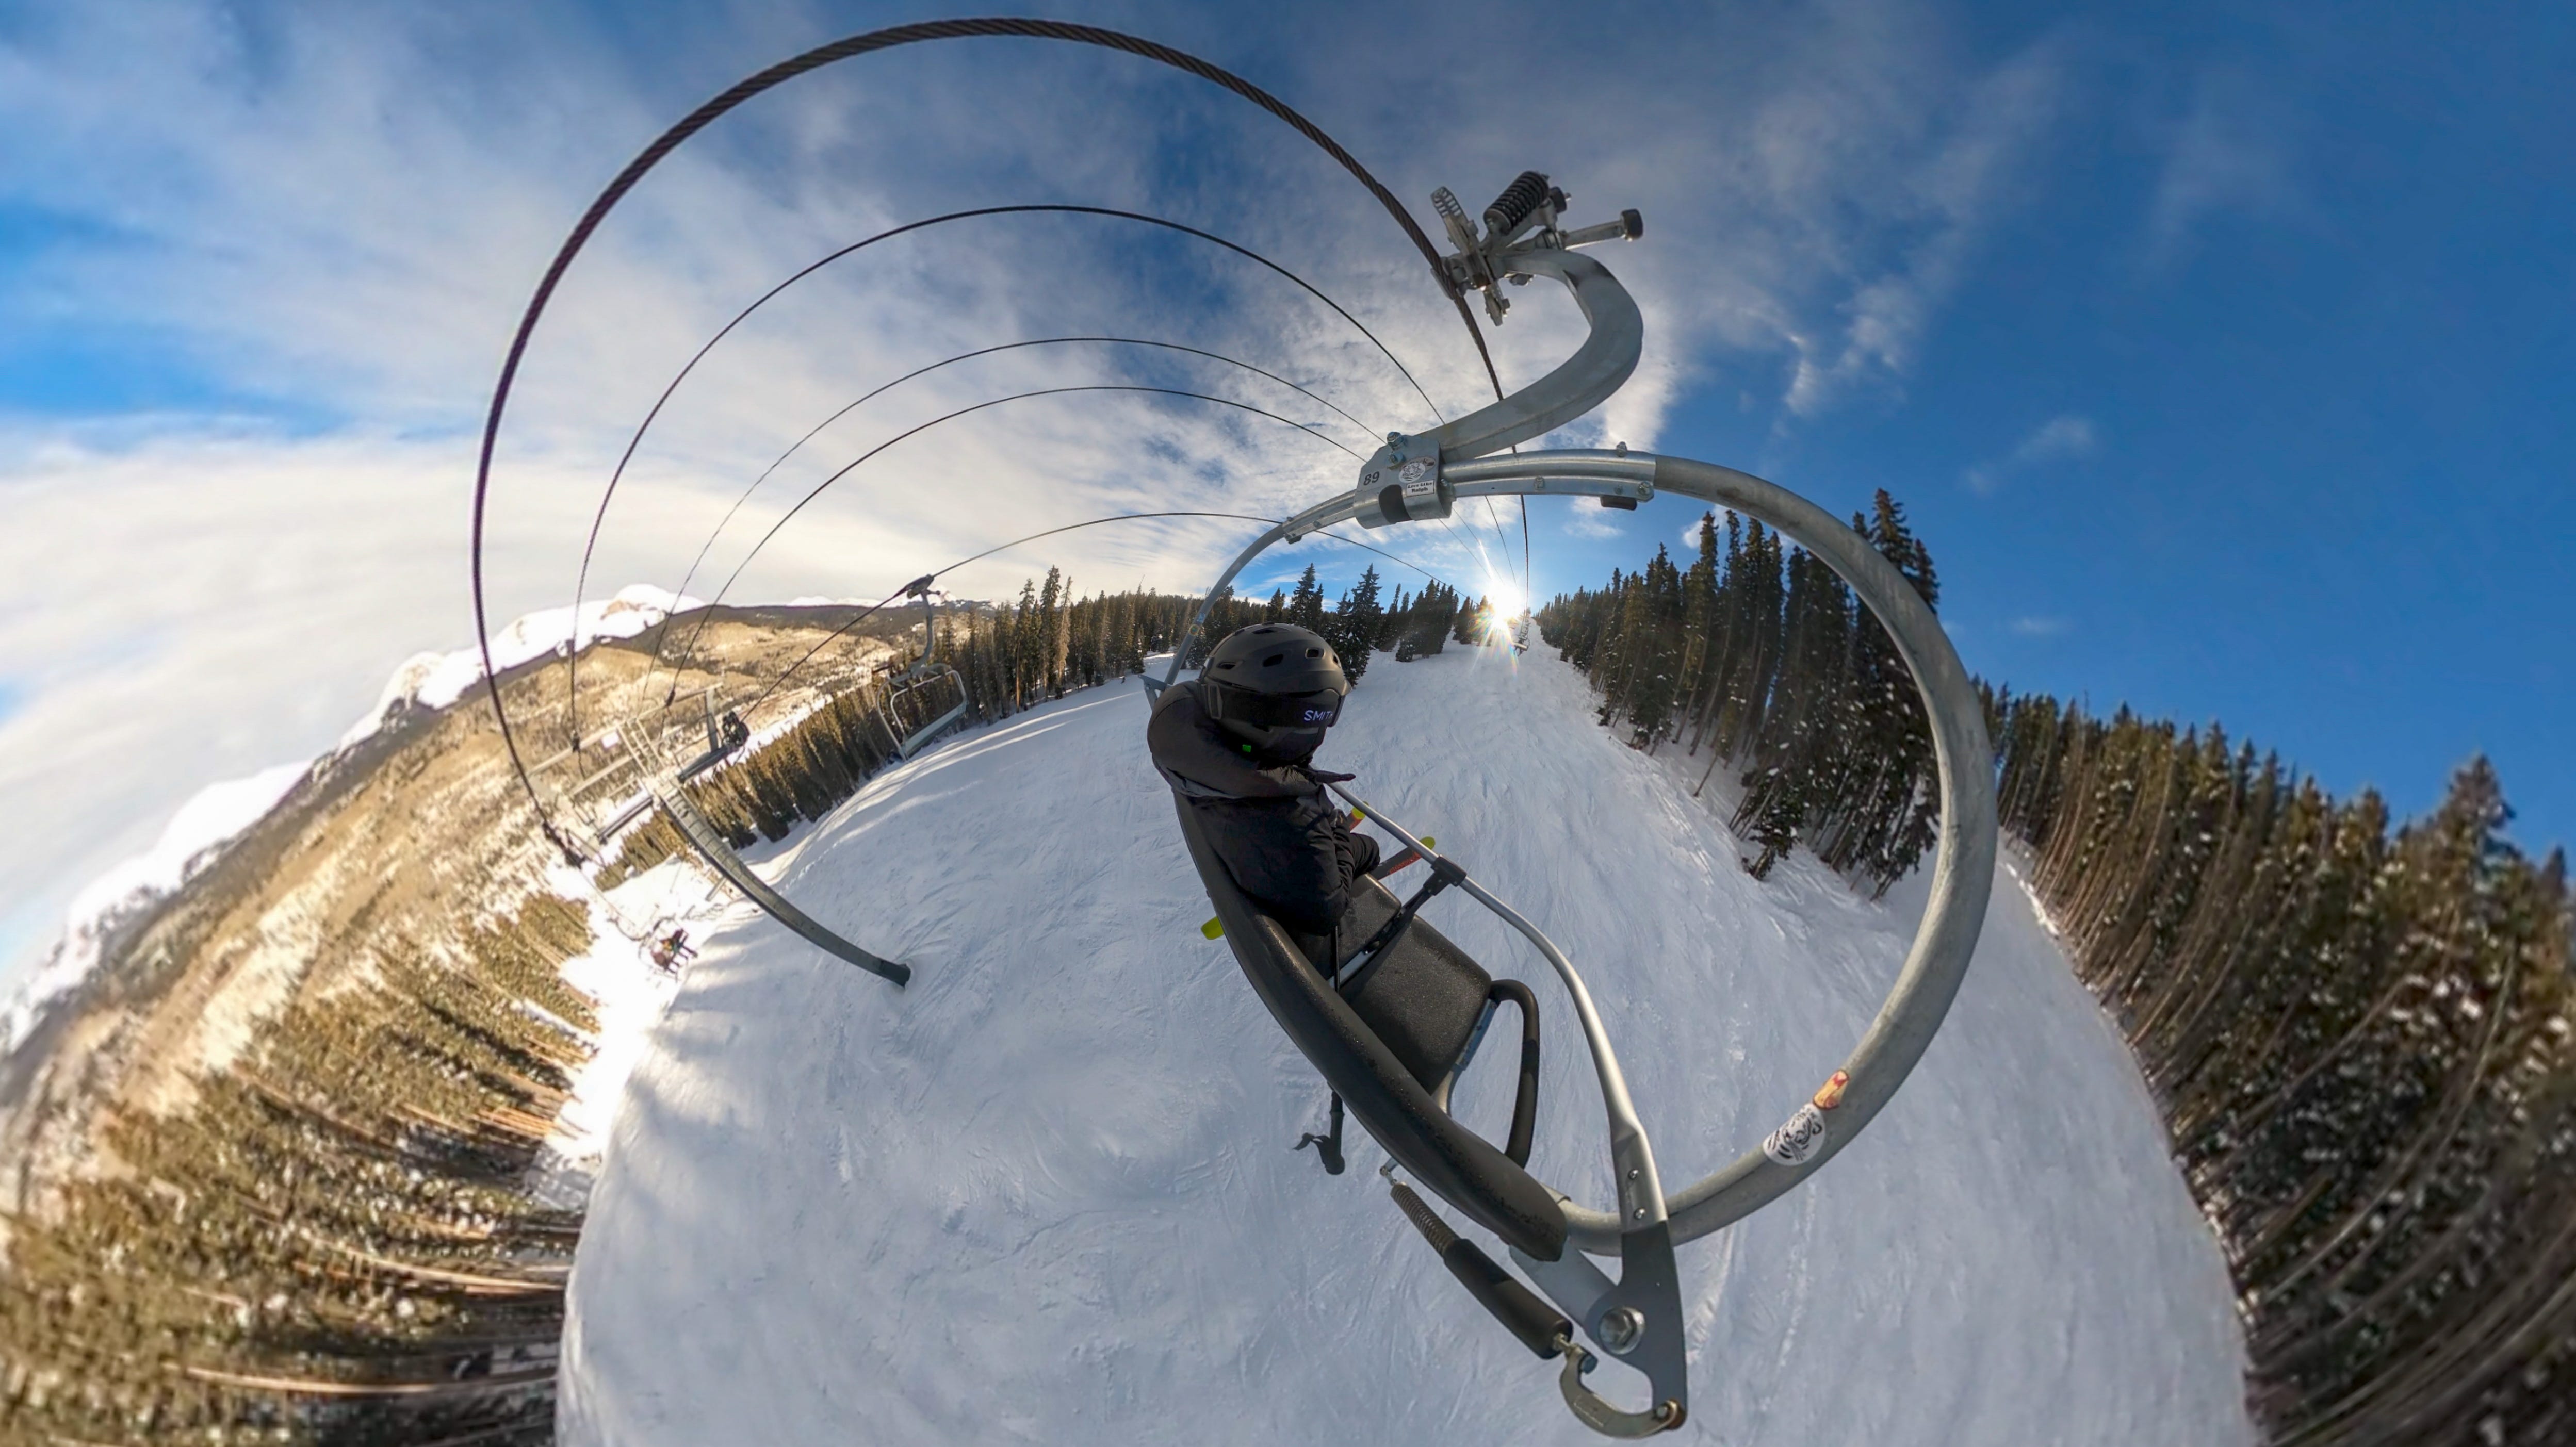
Goofing around with the GoPro
On a recent day skiing at Purgatory, I played around with my GoPro Max 360-degree camera, which uses two fisheye lenses to film in all directions. Below are some frame grabs from the footage.
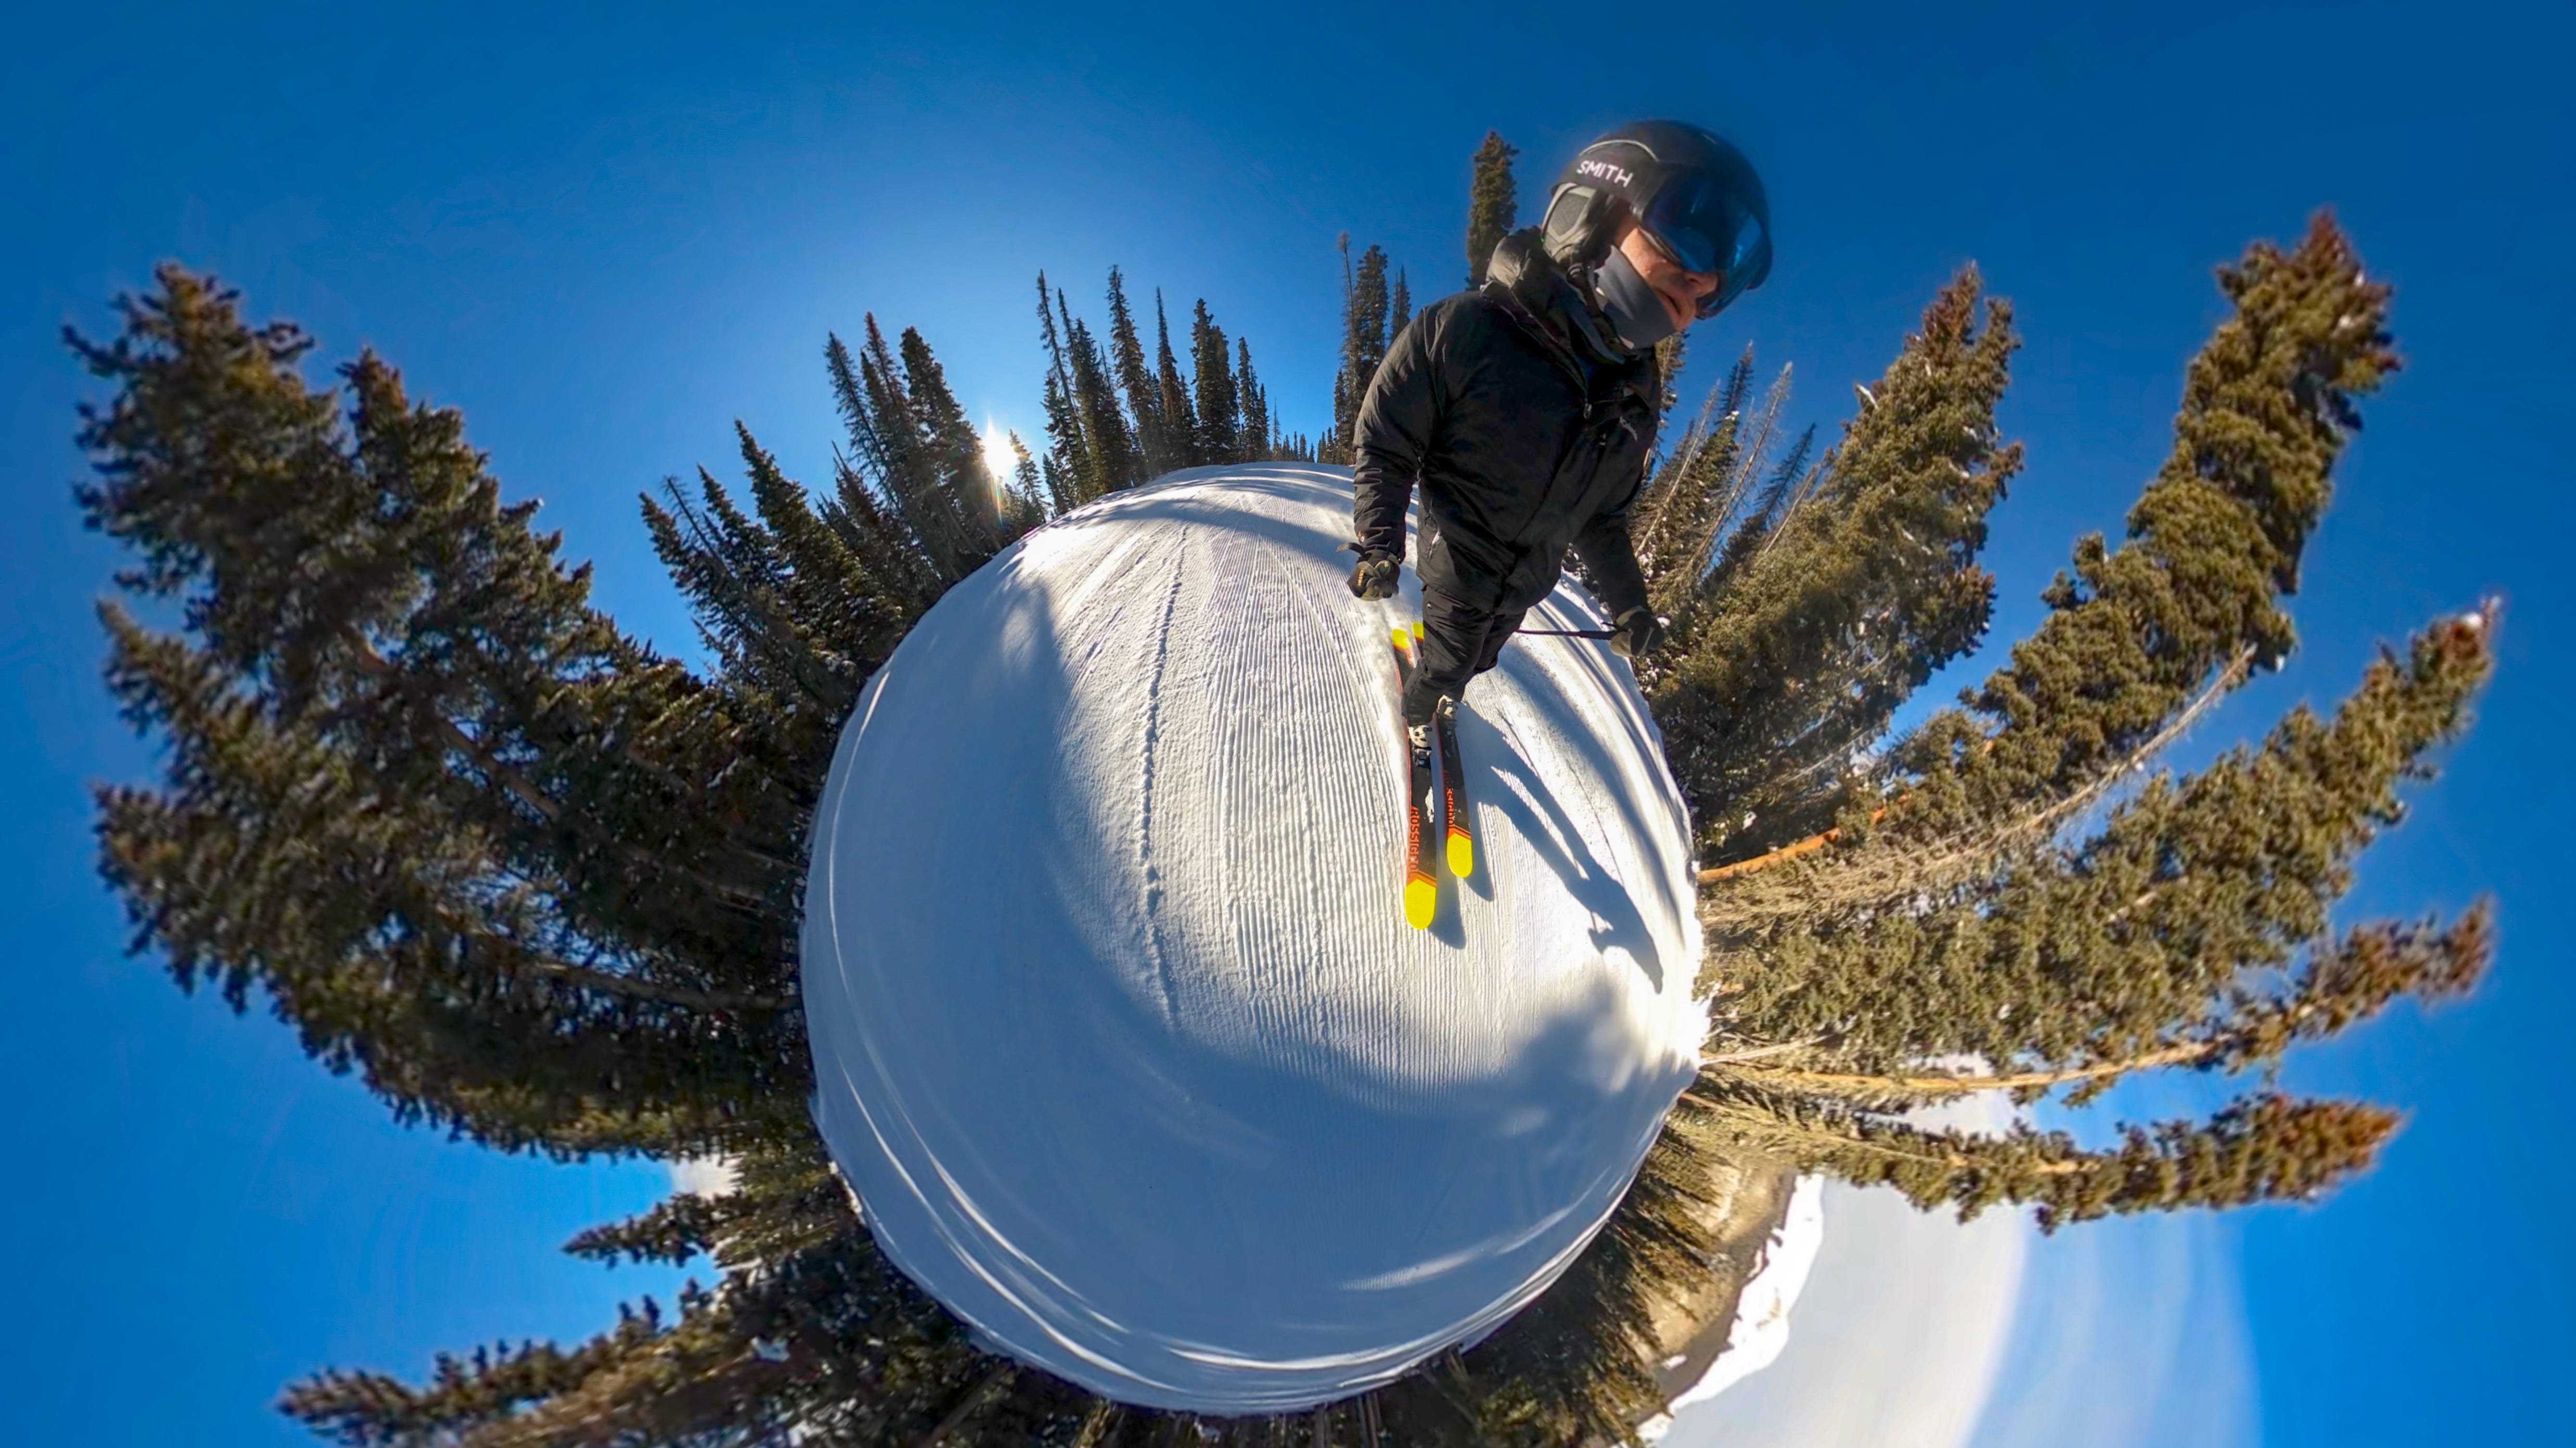

In a world awash in dreadful AI images, the journalist in me cringes at the digital stitching of the imagery that magically removes the selfie stick (or ski pole). As a photographer, I usually shoot for verisimilitude.
At the same time, I find these distorted views can sometimes capture the essence of skiing better than traditional rectilinear images. But maybe that’s just my warped personality.