
Snow news roundup
Plus, SnowSlang: I is for the many types of ice formations


Here’s a quick rundown of snow-related stories I’ve been reading lately:
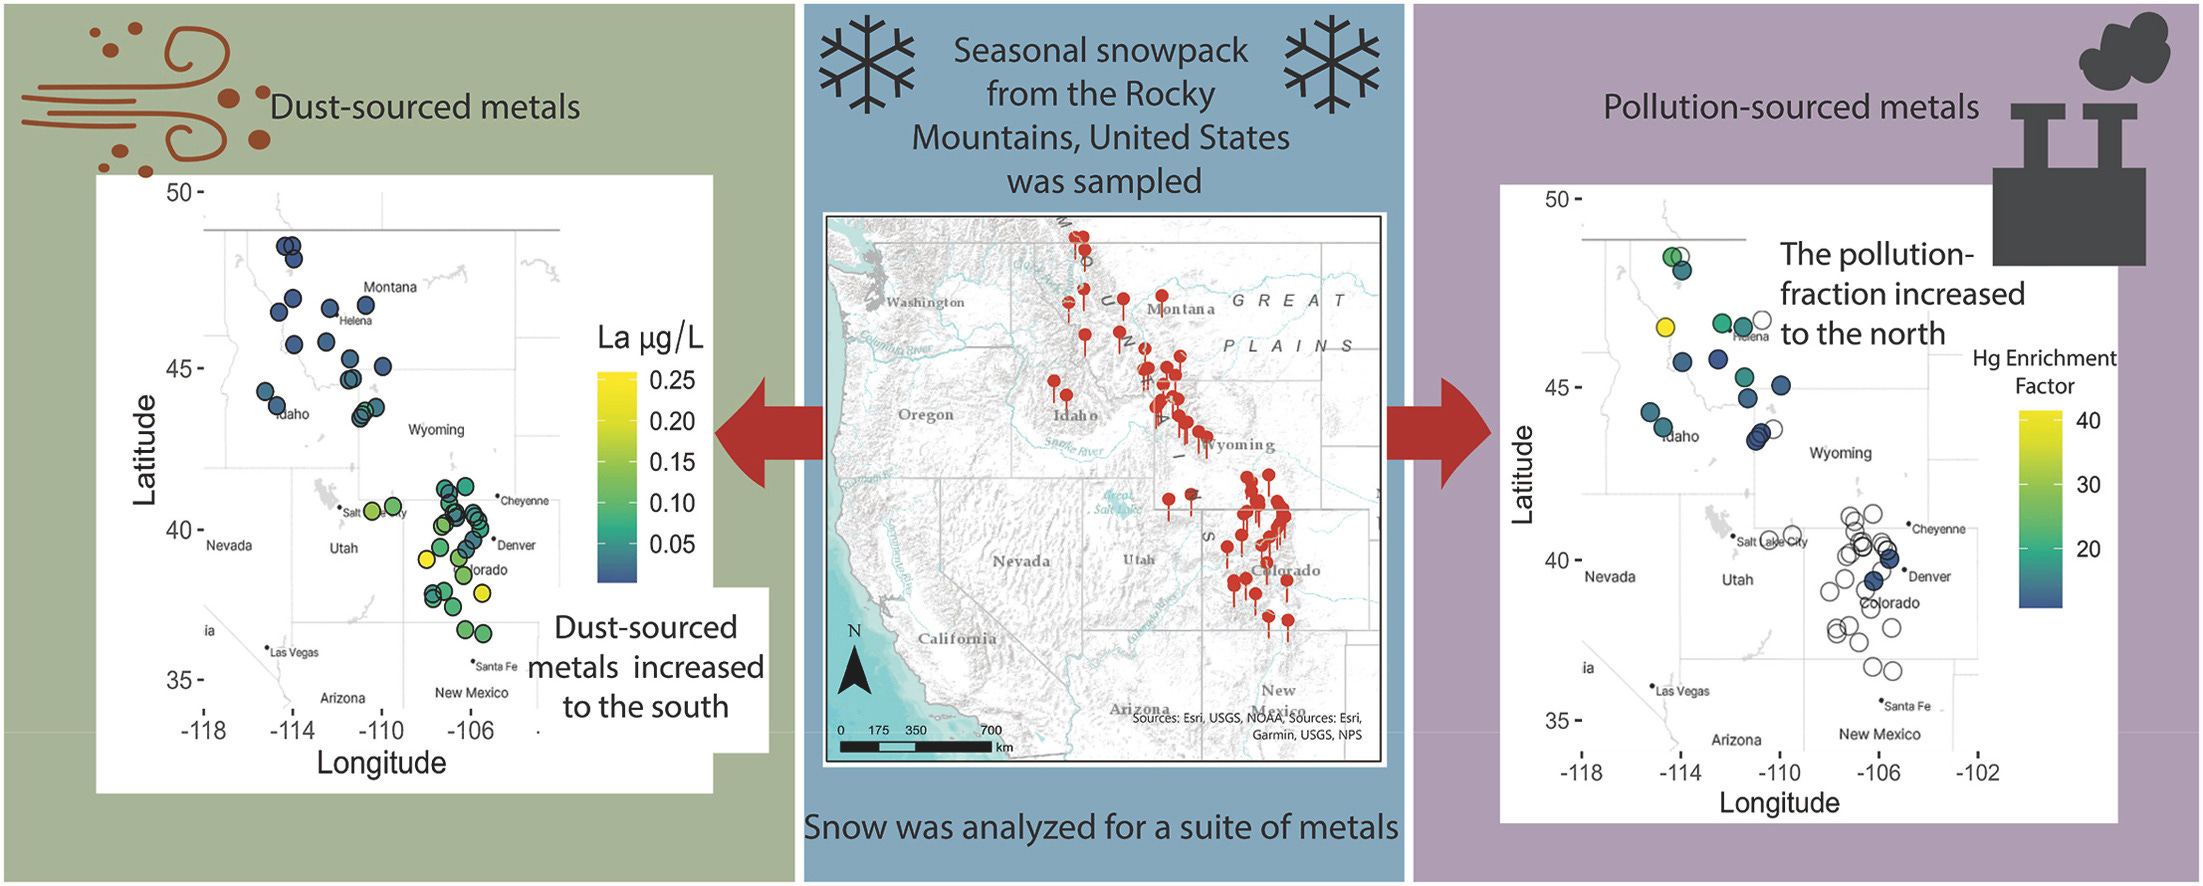
⛏️ “Rocky Mountain snowpack is contaminated by mercury and other metals, study finds.” Kaleb Roedel, KUNR, 4/8/25.
Researchers examined nearly 50 sites in the Rockies and found a variety of metals in the snowpack, according to a new study in Environmental Pollution, which highlights that “contaminant sources potentially include current and historical mining, and smelting.” The highest levels of contamination were in the northern Rockies, and scientists “identified mines in the Pacific Northwest, Idaho, and Montana as the likely source by following winter storms back in time,” according to the Desert Research Institute, one of the organizations involved in the study.
☠️ “How Snow Becomes Deadly.” Judson Jones and Lily Boyce, The New York Times, 4/11/25.
This excellent example of scrollytelling explains how slab avalanches form and includes a story/photos about the ski patrollers who work to keep visitors safe from these potentially deadly hazards.
🥵 “No good news in the snowpack and water supply numbers.” Russ Schumacher, Colorado Climate Blog, 4/14/25.
“To recap how we got here, the snow season got off to a huge start in November, then came one of the driest winters on record in the mountains. March was a little more active, but was also quite warm,” writes Colorado’s state climatologist. “From the perspective of ‘snow drought’ and water supply for the coming summer, this is not what you want the snowpack map to look like in mid-April.”
The piece includes a discussion of long-term snowpack trends in Colorado and notes that even within this one state, the story differs depending on your location: “In Colorado’s northern mountains, trends over the last 45 years are fairly modest overall, with some mixed signals. But in the southern mountains, the data make a very clear statement: snowpack is declining, and the peak is happening earlier.”
BTW, below is the status of the West’s snowpack. This late in the season, maps like these start to show anomalies, like the 1,500% reading in the Milk River Basin along the Montana/Canada border. When the median snow water equivalent for the date is meager, the percentages can go wild and exaggerate reality.

⛷️ “How to Ski with Your Kids and Not Hate Life.” Stuart Winchester, The Storm Skiing Journal and Podcast, 4/8/25.
I endorse these 10 pieces of advice (e.g., rent gear seasonally, buy passes, enroll kids in lessons, buy bootbags, pack lunch, etc.).
🌨️ “The Cult of the Mountain-Town Weatherman.” Heather Hansman, Outside, 3/11/25.
Great story about our local meteorological guru, Jeff Givens (aka Durango Weather Guy), and others like him across the West. “Outdoorsy residents in places like Mammoth and Durango may end up in a particularly close parasocial relationship with their local weatherperson because the weather they predict has a big impact on their lives,” Hansman writes. “If you prioritize being outside, especially if you live in a place where raging heat, big snowstorms, and wild monsoons are all common, your daily decisions and even your general psyche follow the curve of the weather forecast.”
🅿️ “In a Snow Paradise, They Live in This Parking Lot.” Rukmini Callimachi and Erin Schaff, The New York Times, 4/11/25.
Exorbitant housing costs and limited options in ski towns are especially challenging for the many workers who make low wages catering to tourists, leading to homelessness amid plenty. This feature tells the story of a special parking lot in Frisco, Colorado. “People experiencing homelessness can sleep in their cars in this wealthy ski town in Colorado, but only if they have a job,” according to the story.
😢 “A beloved skier, an audacious jump and the complex grief left behind.” Roman Stubbs, The Washington Post, 4/5/25.
A heartbreaking tale about a tragedy on Colorado’s Berthoud Pass: “When 21-year-old Dallas LeBeau vowed to clear a highway to win a contest and social media clout, his parents felt helpless to stop him. Now they’re left with regret.”
SnowSlang: I is for the many types of ice formations
One of the things I’ve found challenging in learning about the cryosphere is the large number of terms related to ice, such as ice sheets, ice caps, ice shelves, and icebergs, all of which begin as snow. There’s also sea ice and its various forms.

Below is a brief primer I wrote to teach myself about some of the terminology, plus a few interesting graphics. My main sources are the National Snow and Ice Data Center’s (NSIDC) explainer on the cryosphere, and the European Union’s Copernicus Climate Change Service.
Ice sheets versus ice caps
These two terms are related and describe vast areas covered by glacial ice, but they’re distinguished by size: ice sheets refer to frozen expanses larger than 50,000 square kilometers (19,305 square miles) while ice caps are below this threshold.
Today, there are only two ice sheets on Earth: the Greenland and Antarctic ice sheets, but in prior Ice Ages, there were others, such as the Laurentide Ice Sheet that covered most of Canada and parts of the northern United States.
“During the peak of the last ice age, glaciers and ice sheets covered about 32 percent of Earth’s total land area,” according to NSIDC. “On average, the ice on both the Greenland and Antarctic Ice Sheets, which has accumulated over millions of years, is more than 2 kilometers (1.2 miles) thick. The colossal weight of both ice sheets has pushed down the land under them.”
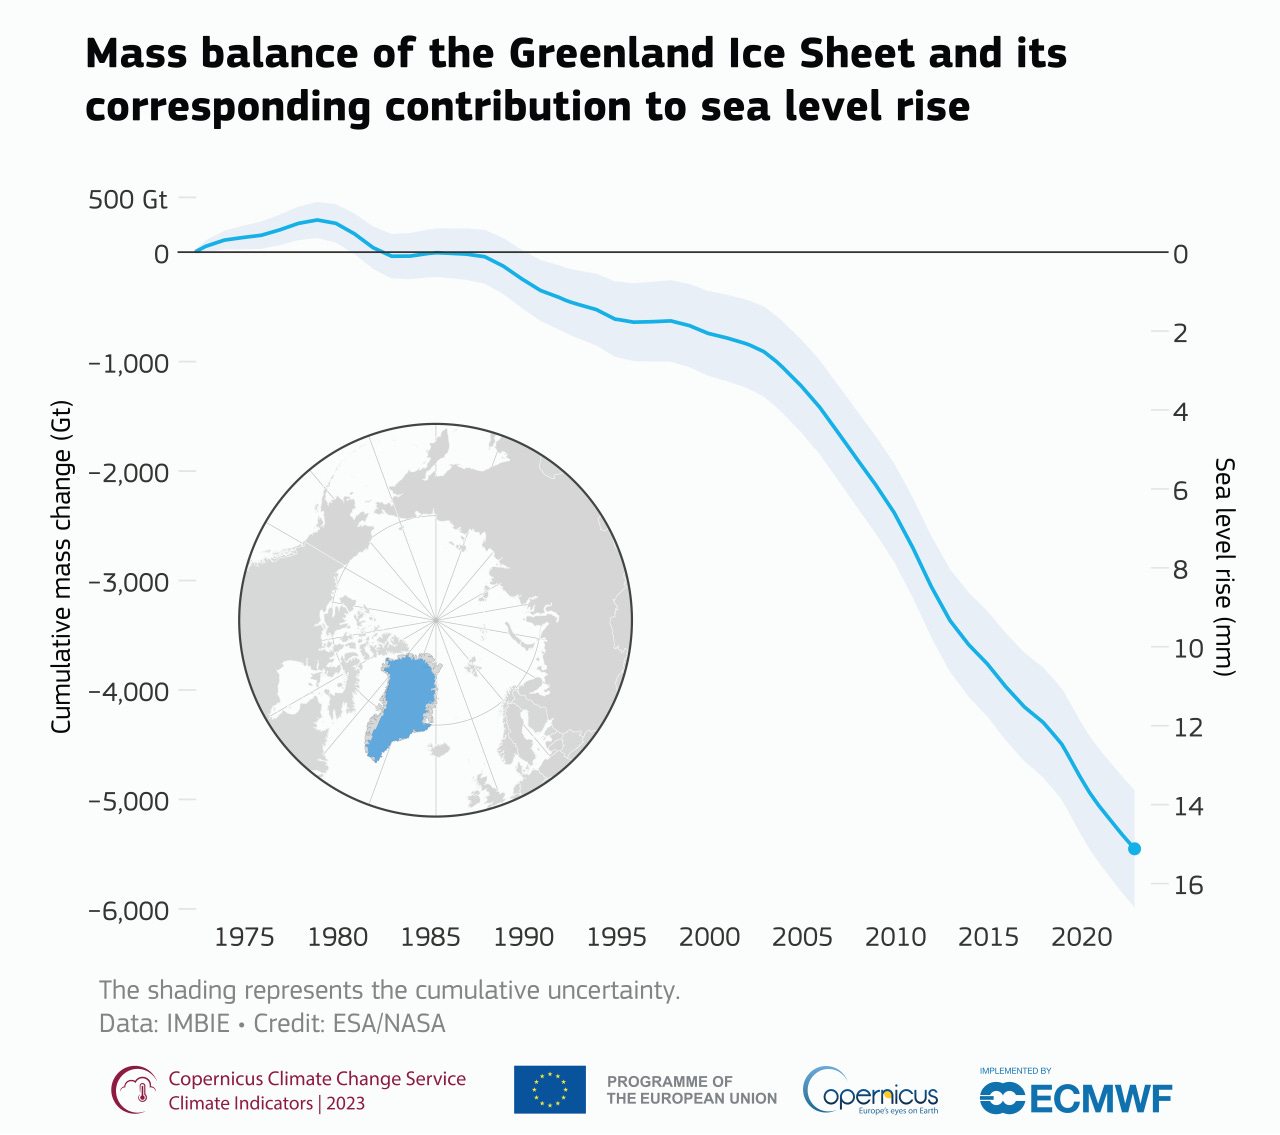
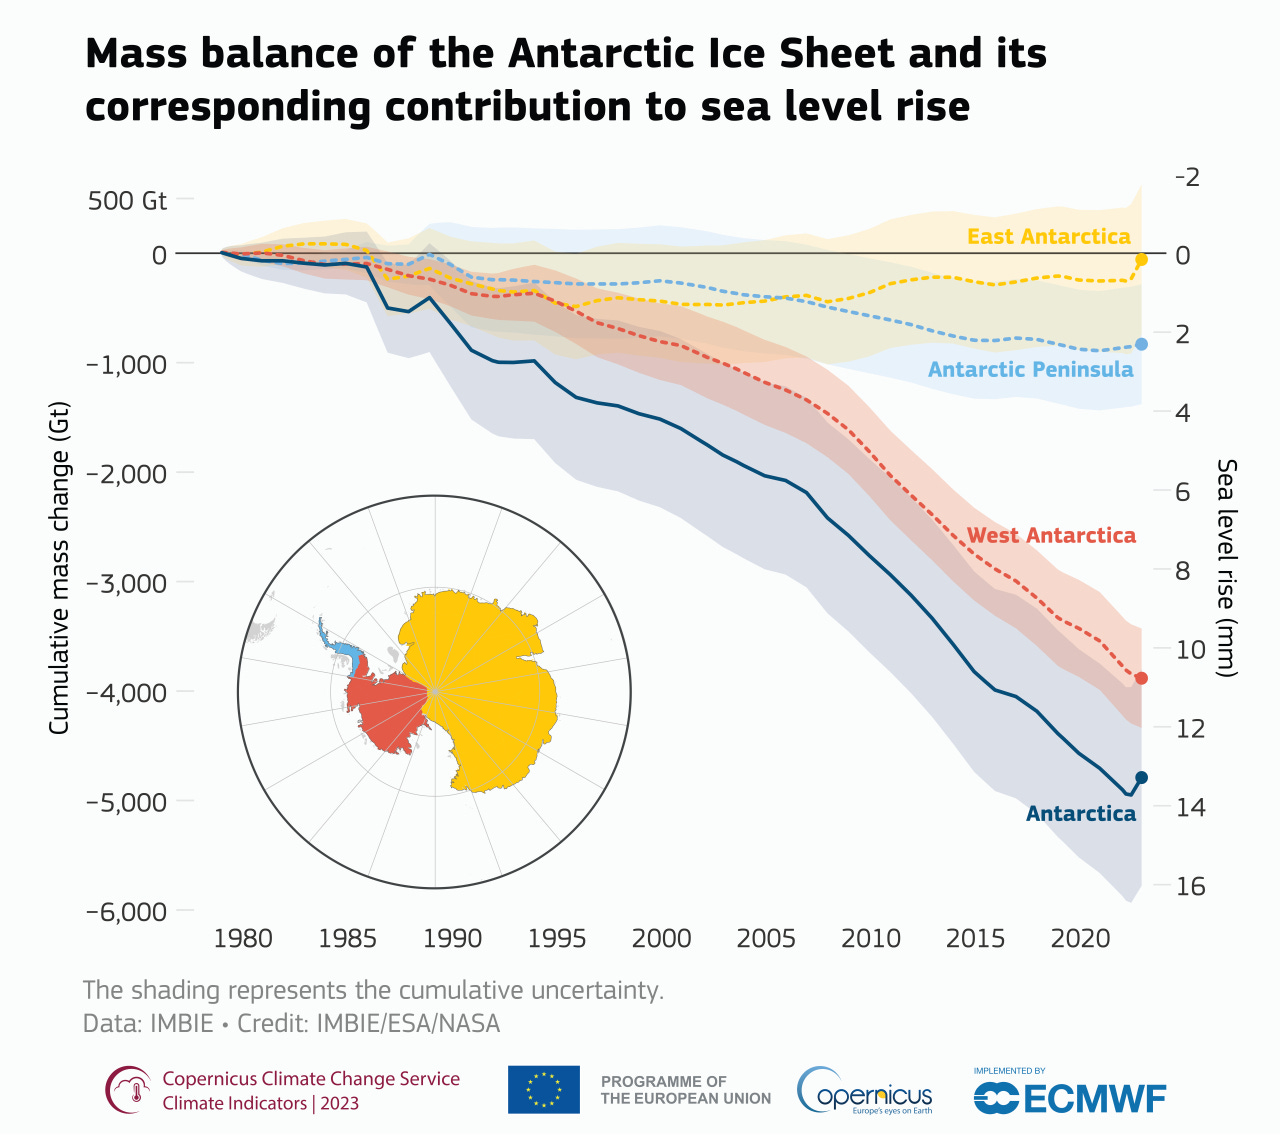
It’s hard to talk about ice sheets without mentioning the prospect of them melting due to climate change and the resulting change in sea levels. “Data from 2020 show that if the entire Greenland Ice Sheet melted, sea levels would rise about 7.4 meters (24 feet); if the entire Antarctic Ice Sheet melted, sea levels would rise about 60 meters (200 feet),” according to NSIDC.
The graphic below shows that the mass balance of the Greenland Ice Sheet has been plummeting.
Down around the South Pole, Antarctica’s ice sheets have shown different rates of change since 1980, but the one in West Antarctica has declined steeply.
Ice caps are smaller versions of ice sheets. They also spread out like a dome, and they’re usually comprised of merged glaciers (see this previous post for more on glaciers).
“Northern Europe is home to many ice caps, such as the Vatnajökull ice cap in Iceland and the Austfonna Ice Cap in the Svalbard Archipelago of Norway, the latter of which is the largest ice cap (in area) in Scandinavia,” according to NSIDC. “The largest ice cap in the world is the Severny Island ice cap, part of the Novaya Zemlya Archipelago in the Russian Arctic. Ice caps are also found in mountain ranges like the Himalayas, Rockies, Andes, and the Southern Alps of New Zealand.”
I should also note that the term “polar ice cap” is sometimes used to describe the frozen expanses of the Arctic and Antarctica, writ large, not to mention the high-latitude regions of other planets, such as the Martian polar ice caps, which are made of frozen water and carbon dioxide (“dry ice”).
Ice shelves and icebergs
Just as it makes sense to pair ice sheets and ice caps, I’m lumping together ice shelves and icebergs because the former gives birth to the latter in a process known as calving.
Ice shelves are the floating extensions of land-based ice, and most of them are found around Antarctica, as shown in the map below.

“Ice shelves range in thickness from about 50 to 600 meters (160 to 2000 feet), and can extend tens to hundreds of miles from the coast, where the ice first goes afloat,” according to NSIDC. “Some ice shelves have persisted for thousands of years.”
Ice shelves slow the flow of glaciers and are sensitive to warming ocean temperatures. “Several of the ice shelves around Antarctica have recently collapsed dramatically, rather than retreating in a slow and steady manner,” according to this informative page from AntarcticGlaciers.org.
You surely know about icebergs, the free-floating chunks that have broken away from ice shelves or glaciers. Some interesting factoids about them:
The different densities of the ice and seawater cause about 90% of the iceberg to lie below the surface, only exposing the “tip of the iceberg.”
The largest iceberg on record, known as B-15, was about 4,250 square miles, comparable in size to Connecticut or Jamaica.
Icebergs can take on different colors: blue ice is dense and lacks air bubbles due to long periods of compression; green (!) colors are due to marine ice forming on the underside of the icebergs and interacting with iron, as described in this interesting video below from the American Geophysical Union:
Sea ice
Sea ice doesn’t originate as snow—it’s frozen seawater around the poles. Its extent varies dramatically across the seasons, as shown in the series of maps below:

And here’s a pair of animations showing how the extent of sea ice changes throughout the year around the north and south poles, with a distressing lack of ice during 2023 compared to the long-term average.


There are big differences between Arctic and Antarctic sea ice. The Arctic is a semi-enclosed ocean, so surrounding land masses constrain sea ice. Antarctica is a continent surrounded by open ocean, so sea ice can float northward, where it melts in warmer waters. “As a result, almost all the sea ice that forms during the Antarctic winter melts during the summer,” according to NSIDC.
In March, NSIDC reported that Arctic sea ice hit a record low maximum extent for the year—the smallest such reading in the 47-year satellite record. Last week, NOAA said that Antarctica’s 2025 summer minimum sea ice extent was the second-lowest on record. Overall, Antarctic sea ice “shows large year-to-year variability and no clear long-term trend since 1979,” according to the Copernicus Climate Change Service.