SnowVis: ski resort fatalities and catastrophic injuries
Plus: an update on the snowpack and the Southwest's "exceptional" snow drought
In a recent post, I analyzed data on avalanche fatalities, which naturally got me wondering about deaths within the boundaries of ski resorts.
Pardon the morbid curiosity, but I’m a former newspaper reporter who periodically covered the police/fire beat, listening for hours to a scanner so I could rush out to write about tragedies.
The good news is that skiers and snowboarders engaging in an inherently risky activity log tens of millions of visits to ski areas every year, yet the number of fatal injuries is only in the dozens.
The National Ski Areas Association publishes limited data on the number of visitors who suffer fatal or “catastrophic” injuries, such as being paralyzed, but these statistics don’t include people who die of heart attacks, strokes, and other medical conditions. The data also exclude the many significant injuries that send patients to emergency rooms or other facilities for medical care, follow-up surgeries, ongoing physical therapy, and so on.
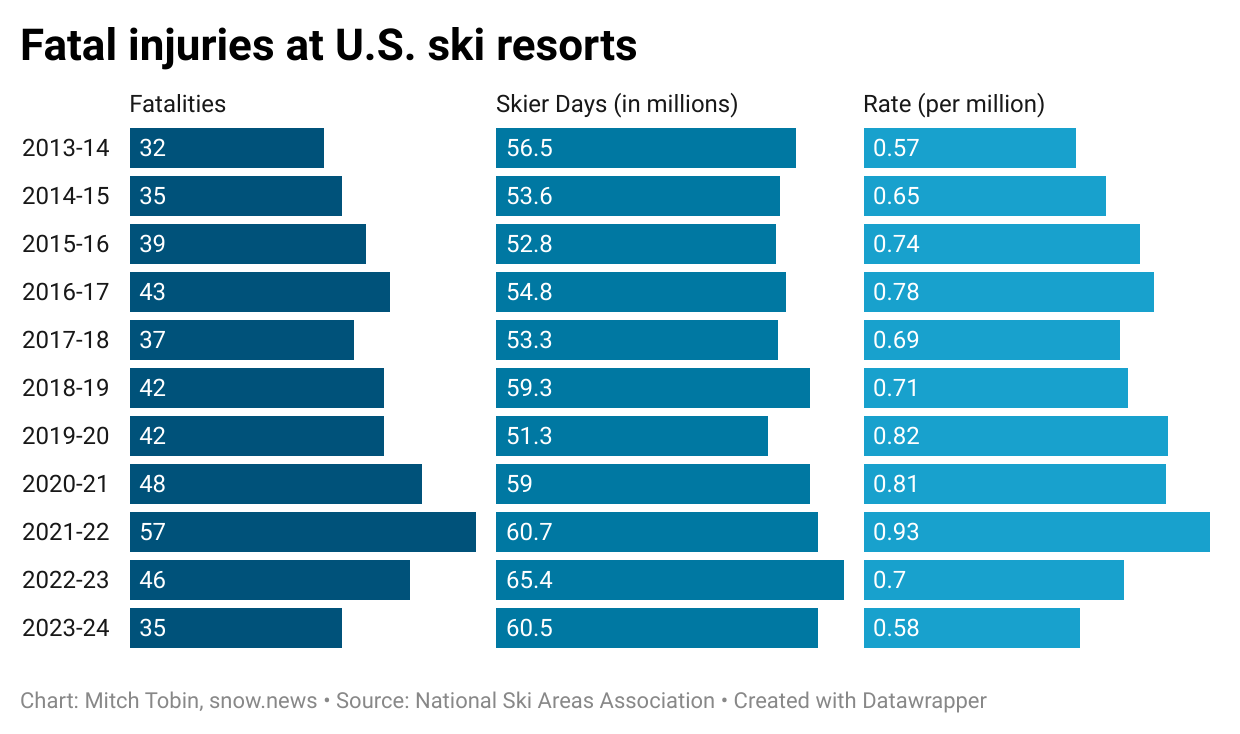
The graphic below shows the number of fatalities, the number of skier days, and the fatality rate per million skier days.
Over this 11-season period, the rate per million approached but never exceeded 1, so I suppose you could say that a fatal injury is a proverbial one-in-a-million event.
“The majority of these fatal incidents involved male skiers on more difficult (“intermediate”) terrain,” according to NSAA. “Speed, loss of control, and collisions with objects continue to be the primary factors in fatal incidents on the slopes.”
The spike in the fatality rate in the 2021-2022 season stood out to me, and I can’t help but wonder if it had something to do with post-pandemic recklessness or newbies getting in over their heads.
NSAA also publishes data on “catastrophic” injuries, which it defines this way:
Life-altering injuries including broken neck or back resulting in full or partial paralysis, serious head injuries, and injuries resulting in the loss of a limb. Eliminated from this statistic are health-related catastrophic injuries (e.g., heart attacks) and the majority of employee catastrophic injuries.
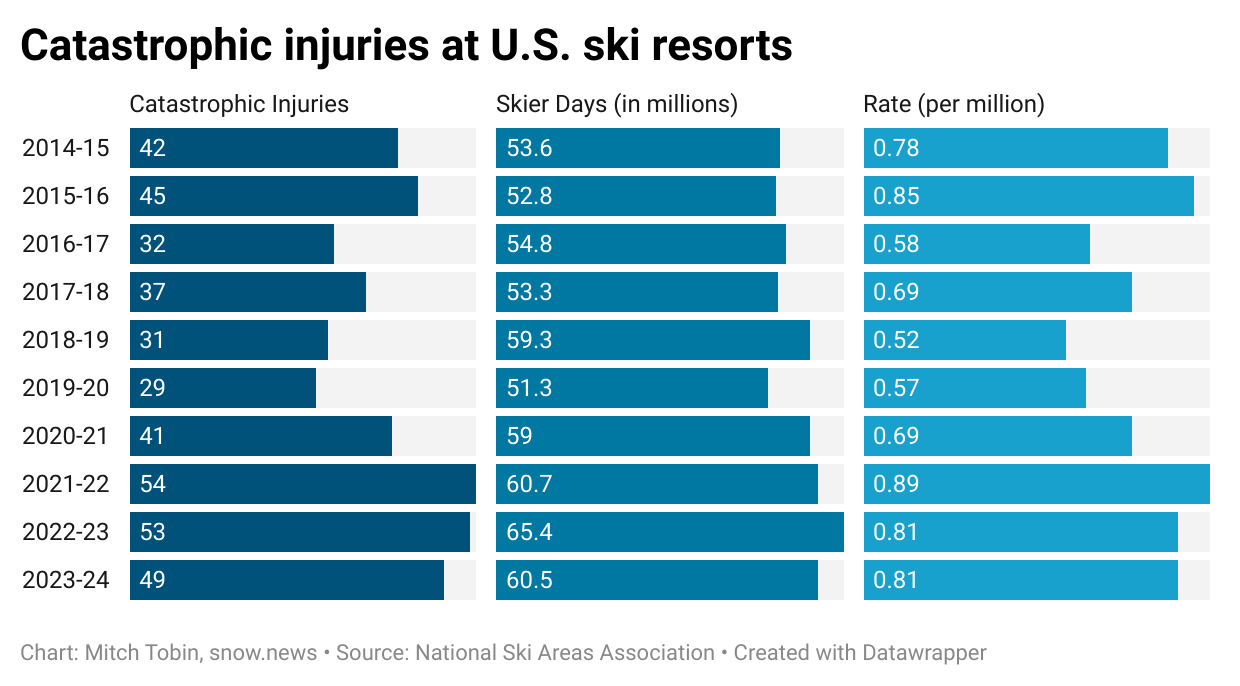
The graphic below summarizes the past decade of catastrophic injuries. The rate remained below 1 per million skier days, and once again, there’s a spike in the 2021-2022 season.
The widespread adoption of helmets is a positive trend, and they can certainly reduce the risk of head injuries. But wearing a brain bucket is no guarantee: all but five of the 35 people who died last season at U.S. resorts were wearing helmets. Just as people perish in car crashes while strapped into seat belts and cushioned by airbags, sometimes helmets aren’t enough to save a life or prevent traumatic brain injuries. I suspect that wearing a helmet also entices some people to take more chances—the perverse effect that researchers call risk homeostasis.
Last season, 90% of skiers/snowboarders wore helmets at U.S. ski areas, up from 25% in 2002/2003, when NSAA started tracking usage. For minors, helmet use was at a record 96%. The graphic below shows slightly outdated figures for overall helmet use.

Two recent projects by journalists shed light on the factors driving ski resort injuries and go beyond the most extreme cases of fatalities and catastrophic injuries. Both are fantastic examples of data-rich investigative reporting:
Analyzing 5 years of injuries, crashes and hit-and-runs at Colorado ski areas. Jason Blevins, The Colorado Sun, 4/8/24.
“All the information gathered shows an increasing concern about safety on ski slopes as crowding and collisions increase,” according to the story. The Colorado Sun spent two years acquiring and analyzing trauma admission data, emergency room visits, sheriff’s investigations into hit-and-run incidents, and ambulance trips from resorts to trauma centers.
GoPros, gummies, reckless abandon: Why ski slopes are getting more dangerous. Jack Dolan, The Los Angeles Times, 3/22/24.
“In California alone, more than 6,000 skiers and snowboarders visited emergency rooms in 2022 with injuries sustained on the slopes, according to data maintained by the California Department of Health Care Access and Information,” Dolan writes. “And the number of recorded injuries is rising at an alarming clip. Ski-related ER visits are up 50% from 2016 through 2022, the state data show. During that same period, the number of skiers and snowboarders remained essentially unchanged in California, according to industry data.”
Snowpack update
Spring skiing is great—except when it comes in early February. At Purgatory on Sunday, I saw people wearing short sleeves. It was warm enough to make the snow wet and sticky at the bottom of runs. Patches of soil were starting to peek through and the parking lot was a muddy mess.
Recent atmospheric rivers boosted the snowpack in some parts of the West, but around here in the Four Corners, conditions remain fairly bleak.
“Exceptional snow drought persists in the Southwest (Arizona, Colorado, Nevada, New Mexico, Utah) as a result of record dry conditions,” according to a February 5 update from the National Integrated Drought Information System.
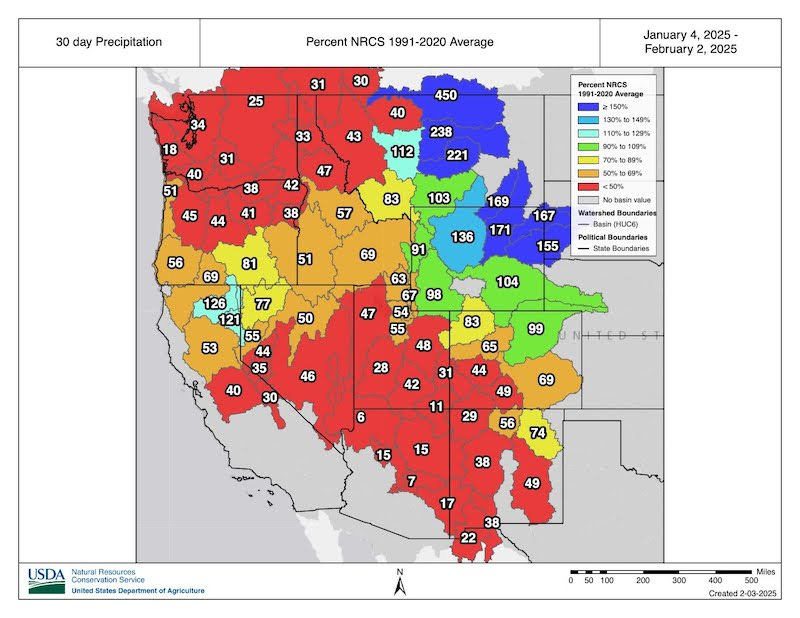
The map below shows 30-day precipitation across the West from January 4 to February 2, with the numbers/colors in each basin indicating the percent of average.
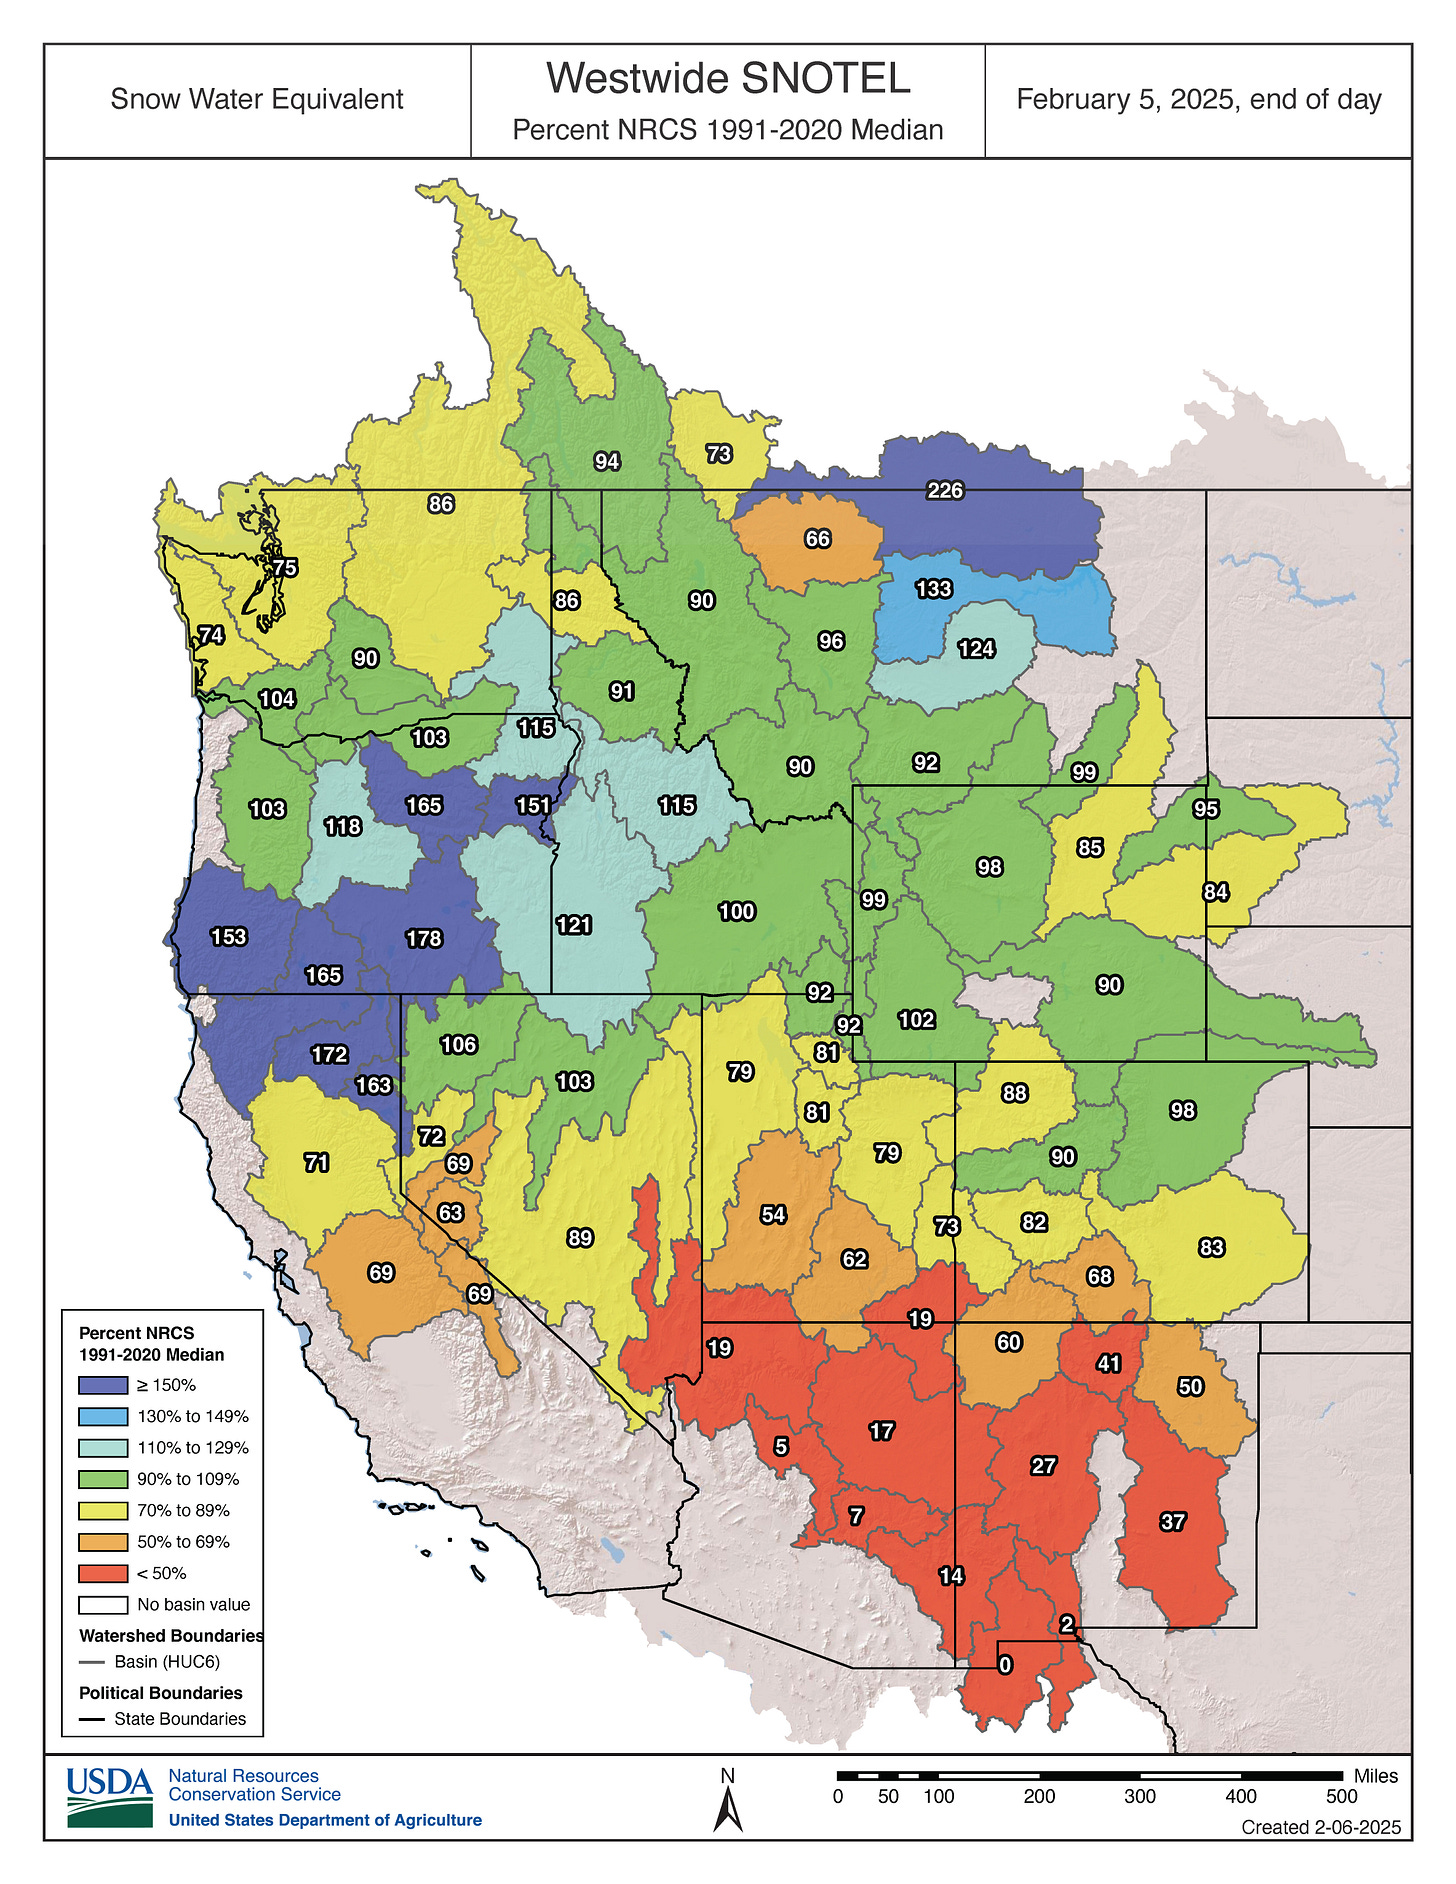
The map below shows current levels of snow water equivalent, and there’s a mosaic of conditions across the West. But there’s plenty of orange and red in the Southwest, where some SNOTEL stations are at record-low levels.
The situation is especially dire in Arizona, as shown in the graphic below. The black line shows the snowpack has been almost non-existent this season; it’s currently at the 0 percentile, meaning it was never this low during the 30-year period of record. Arizona’s statewide snowpack is only 14% of the long-term median and there are just 26 days to go until the median peak on March 3.
The chart below shows a similarly grim picture for the Salt River, which helps supply water to the Phoenix metropolitan area and is currently at 4% of the median and the 2nd percentile with only 18 days to go until the median peak date of February 24.
In early 2002, when another drought was gripping Arizona, I was reporting for the Arizona Daily Star in Tucson and got red-carded as a wildland firefighter along with several colleagues so that we could embed with fire crews in the upcoming season. Sure enough, it was a dreadful year for wildfires across the Southwest, and I fear we’re heading into another treacherous period for the region.
In California, the statewide snowpack is at 75% of normal after flatlining in a very dry January, but conditions vary significantly across the Sierra Nevada, as shown in the graphic below. The snowpack is at 118% of normal in the northern region, but it’s only 69% in the central part of the range and a dismal 48% in southern areas.
Over the past few months, drought has expanded its reach in the Southwest and other parts of the West, but it has receded elsewhere. The first map below is the most recent U.S. Drought Monitor, and the second map shows how the categories have changed in the West since early November.

Looks like we’re heading into a more active pattern next week, but the drought is projected to persist and expand across the Southwest, as shown in the seasonal outlook below that was released on January 31.

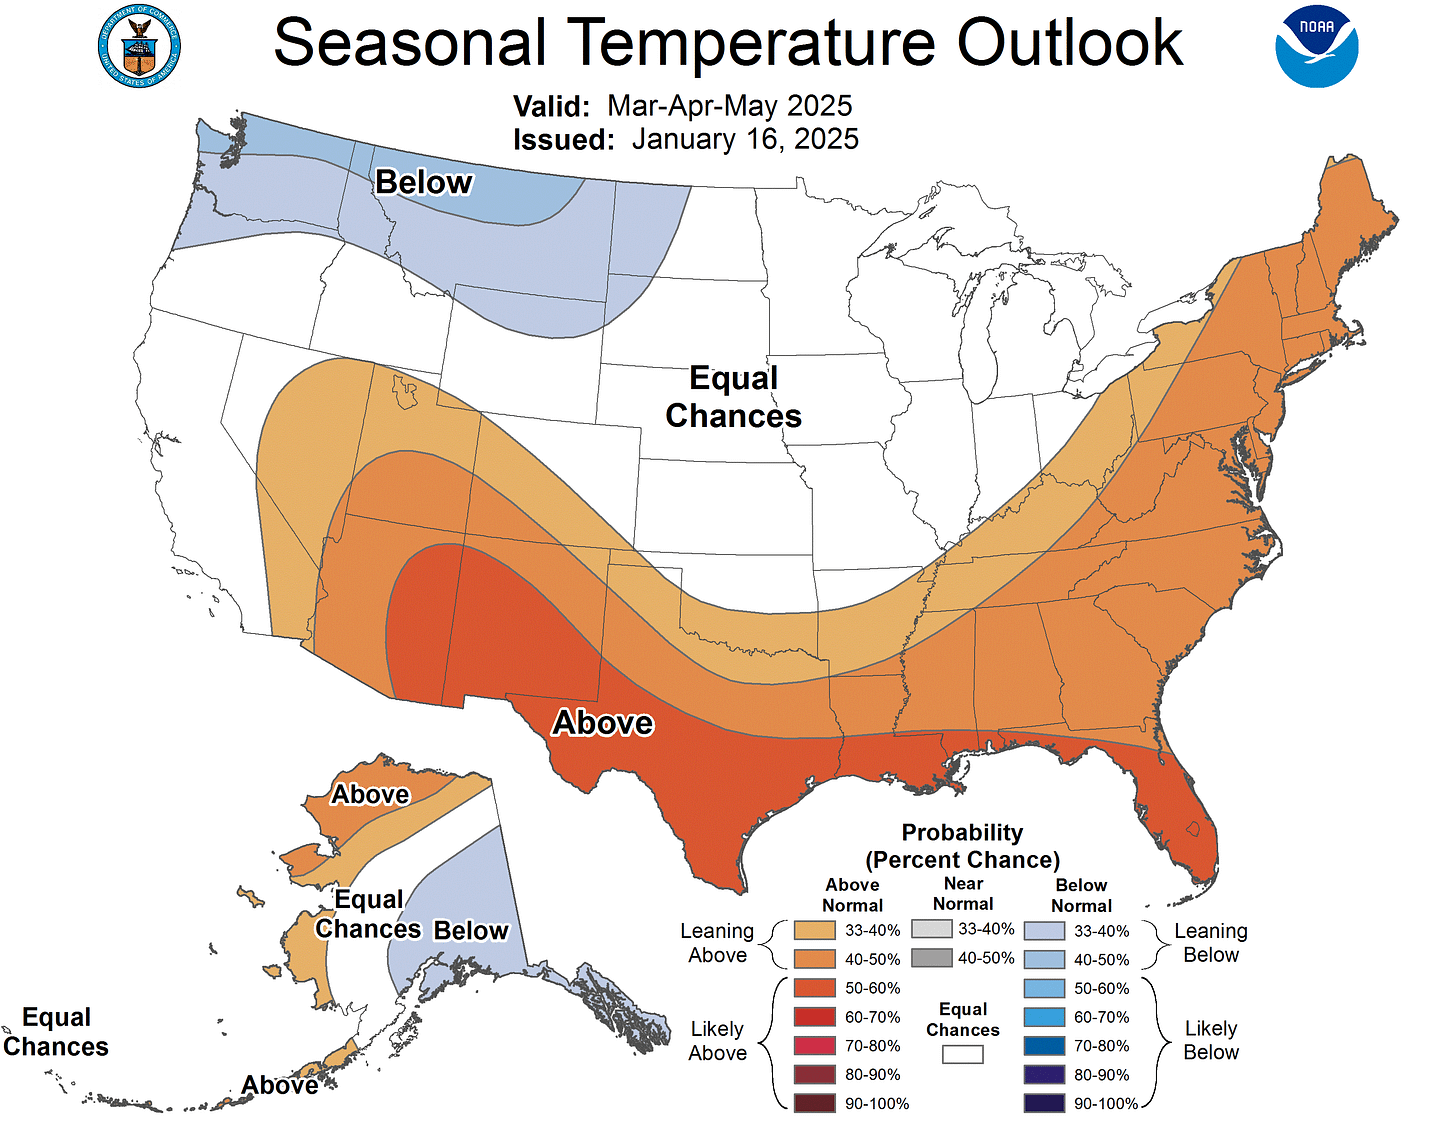
The Climate Prediction Center doesn’t offer much hope for drought relief in the Southwest in the coming months. Here’s the March-April-May outlook for temperature and precipitation:

I shot the panorama below from Purgatory on Sunday. In a better year, this high-country landscape would feature a lot more white, but it’s looking pretty sparse out there.


