SnowVis: "A Breathing Earth" and the "Blue Marble"
Plus, SnowSlang: L is for “lake effect snow,” and September snow photos

The ebb and flow of snow and ice is one of Earth’s defining rhythms. The best visualization that I’ve seen of this annual cycle is the graphic above, known as “A Breathing Earth.”
Created by data visualization expert John Nelson, this animation shows how the cryosphere expands and contracts in the Northern Hemisphere as the planet orbits around the sun.
This map and the one below don’t include the evolution of sea ice around the North/South Pole, yet they’re still powerful depictions of how the land surface changes over 12 months. As I noted in a prior post on the cryosphere, snow covers about one-half of the Northern Hemisphere’s land mass at its winter maximum.
Below is a different version of “A Breathing Earth,” showing two polar views at the top, an equatorial view below, and the month of the year in the strip at the bottom.
In addition to visualizing the coming and going of snow, these maps show how the landscape greens up in warmer weather, with the changes across Africa especially noticeable.
The genesis of these animations is NASA’s Blue Marble project, a collection of high-resolution images of the Earth that recall a famous photograph.
The photo below was taken on December 7, 1972, from about 18,000 miles up, as the Apollo 17 astronauts departed from Earth and headed toward the moon.

This wasn’t the first whole-Earth image, but the photo, which became known as the Blue Marble, had a profound impact on human consciousness, and it’s a reminder of the power of visuals to change the world.
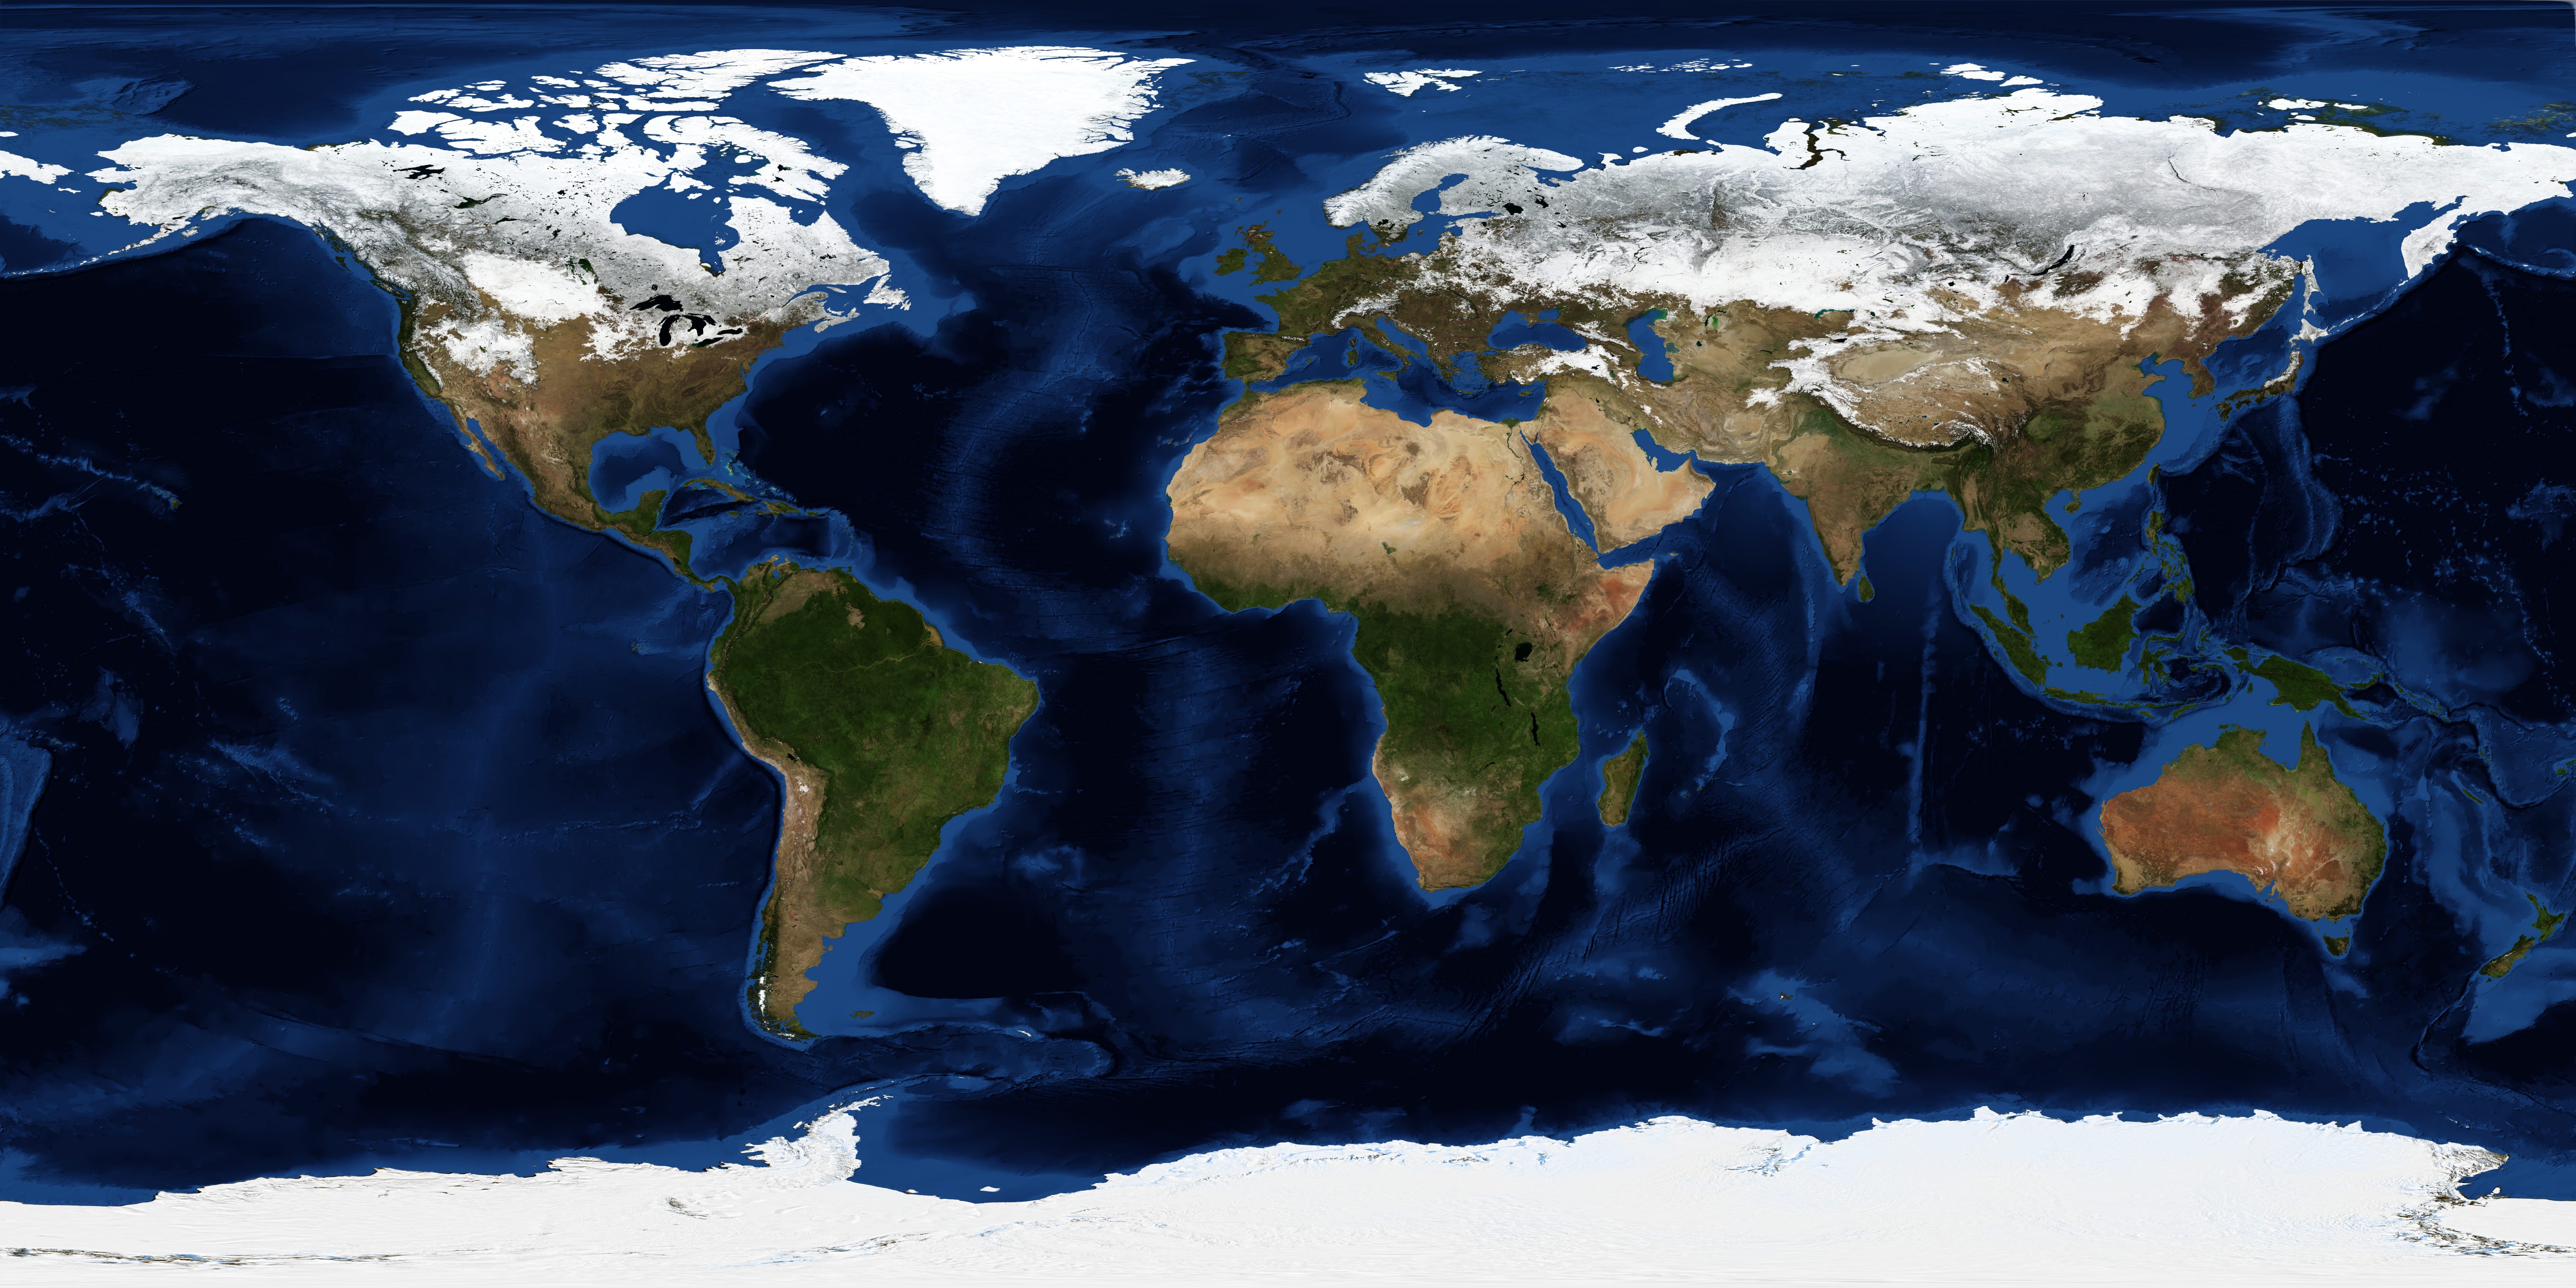
NASA’s Blue Marble visualizations generate cloud-free versions of the Earth by combining a series of detailed photos that were captured throughout the year (more on the project here and here).
Below is an example of the image for February, which includes enhancements for topography on the land and bathymetry (ocean depth). The NASA site offers some ginormous image files that you can download and zoom into (the top resolution is 500 meters, or 1,640 feet).
It’s not as cool as “A Breathing Earth,” but I also found this interesting animation of the monthly maps.
The animation below includes clouds, and while there’s not much of the cryosphere visible, I find this video a little mesmerizing. Africa and the Pacific Ocean look especially large from this vantage.
And, finally, as the Galileo spacecraft departed Earth in December 1990 for its exploration of Jupiter, it looked back and captured this sequence of images over a 25-hour period, offering a stunning view of Antarctica and the Southern Hemisphere.

SnowSlang: L is for “lake effect snow”
When cold air passes over a relatively warmer lake, prodigous snowfall totals may be experienced downwind. This phenomenon, known as lake effect snow, is a prominent feature of winter weather around the Great Lakes, but it also affects other regions, such as the Wasatch Mountains near Utah’s Great Salt Lake.
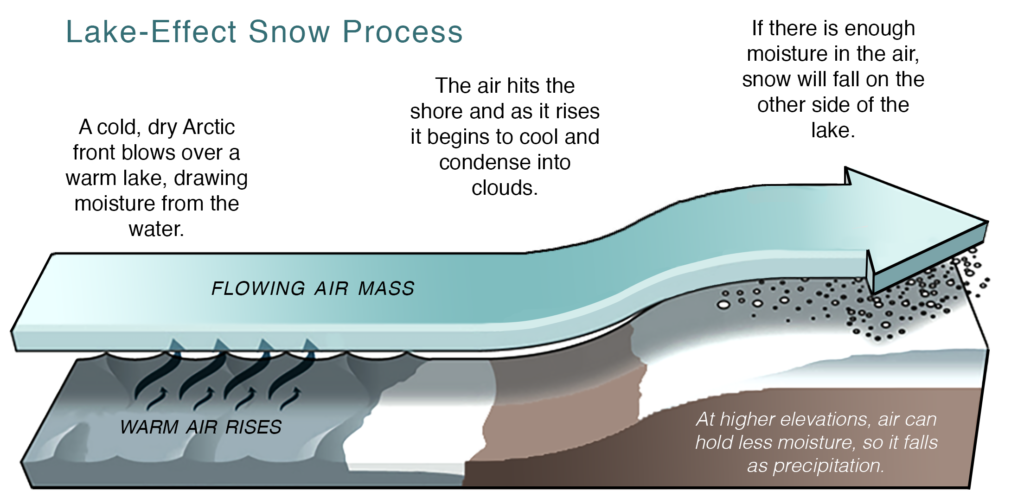
The graphic below from the National Weather Service explains how lake effect snow works. When a cold air mass sweeps across a lake, moisture evaporates from the lake's surface and rises in the atmosphere. As the moisture rises, it cools and condenses into clouds, eventually producing snowflakes. The effect really takes hold on the lee side of the lake as the wind pushes the moisture-laden clouds over land, especially if there’s any elevation gain.

Here’s another diagram, this one from the National Snow and Ice Data Center.
The satellite image below shows the effect at work over the Great Lakes.

“Lake effect snow usually occurs during the late fall and winter months and is capable of producing as much as 2-3 inches of snow an hour with event totals ranging from 60-100 inches,” according to NASA. The process is known as bay effect snow and sea effect snow when the cold air passes over those types of water bodies.
Narrow, intense bands of precipitation are a hallmark of lake effect snow, and these squalls can lead to vastly different conditions over short distances.
“It is not uncommon for sunny skies at a particular location to be quickly replaced by blinding, wind-driven snowfall in a matter of minutes,” according to the National Weather Service. “Similarly, snowfall accumulations can vary from a trace to several inches over a short distance.”
Lake effect snow is why some areas around the Great Lakes are known as “snowbelts,” as shown in the map below.

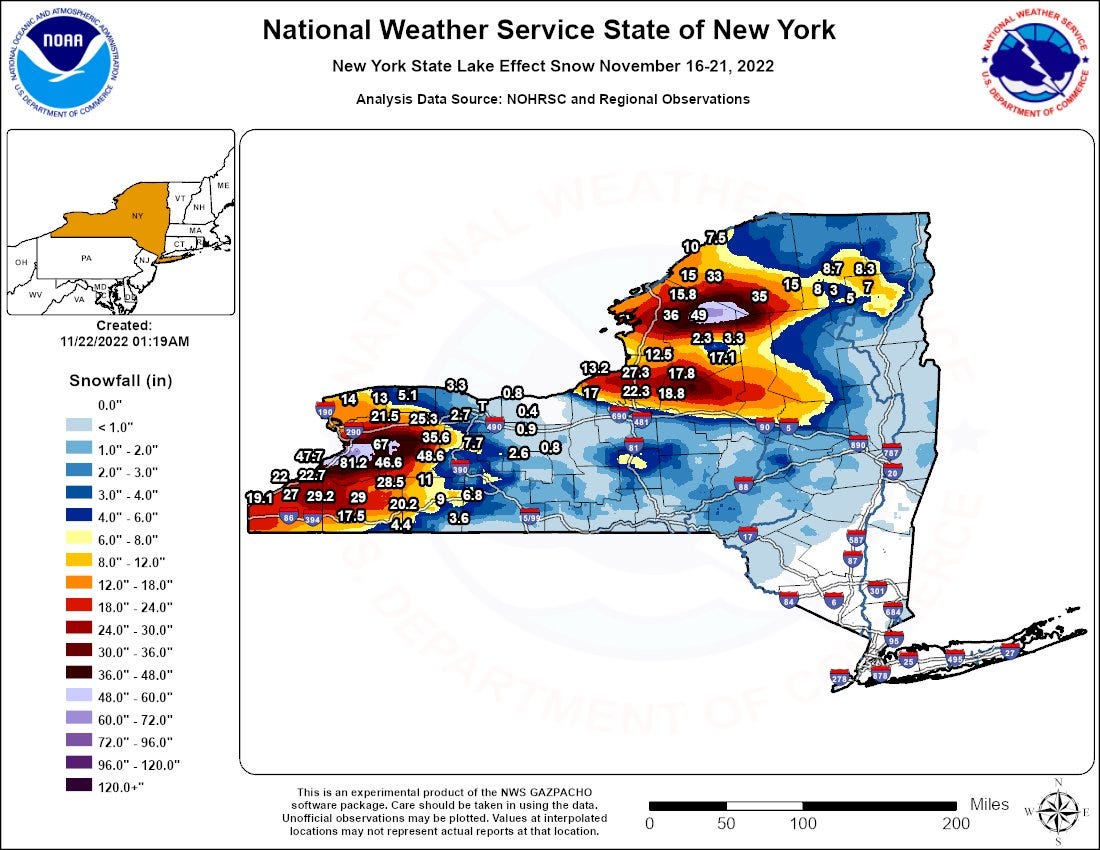
The map below shows an example of a November 2022 storm that dumped up to 81.2 inches in New York.
In the American West, the most famous example of lake effect snow takes place downwind of the Great Salt Lake. I recently enjoyed reading Jim Steenburgh’s Secrets of the Greatest Snow on Earth, in which he devotes an entire chapter to explaining how the lake can amplify snowfall in the nearby Wasatch Mountains.
“Conventional wisdom and marketing hype suggest that the Great Salt Lake effect is the holy grail of Utah powder skiing,” writes Steenburgh.
But the truth is more complicated.
“No Wasatch weather phenomenon is more misunderstood than the Great Salt Lake effect,” he writes, noting that the effect is “incredibly difficult” to forecast.
“In fact, it is so difficult that meteorologists call it the dreaded lake effect (DLE), although we use saltier language in private,” writes Steenburgh, professor of atmospheric sciences at the University of Utah and creator of the wonderfully named blog, Wasatch Weather Weenies.
The lake’s high salinity lowers the freezing point of water, so it never freezes except near freshwater inlets, but that salt water also doesn’t evaporate as readily as freshwater. It takes a special combination of atmospheric conditions to get the Great Salt Lake to produce lake effect snow, and Steenburgh makes a good case for discounting the influence.
“On average, lake-effect periods generate about 5 percent of the snow that falls in the Cottonwoods each winter,” he writes, referring to the two canyons that are home to Alta, Snowbird, Brighton, and Solitude ski areas. “Most skiers and snowboarders are surprised the percentage isn’t higher, but marketers and industry promoters suffer from delusions when it comes to the Great Salt Lake effect.”
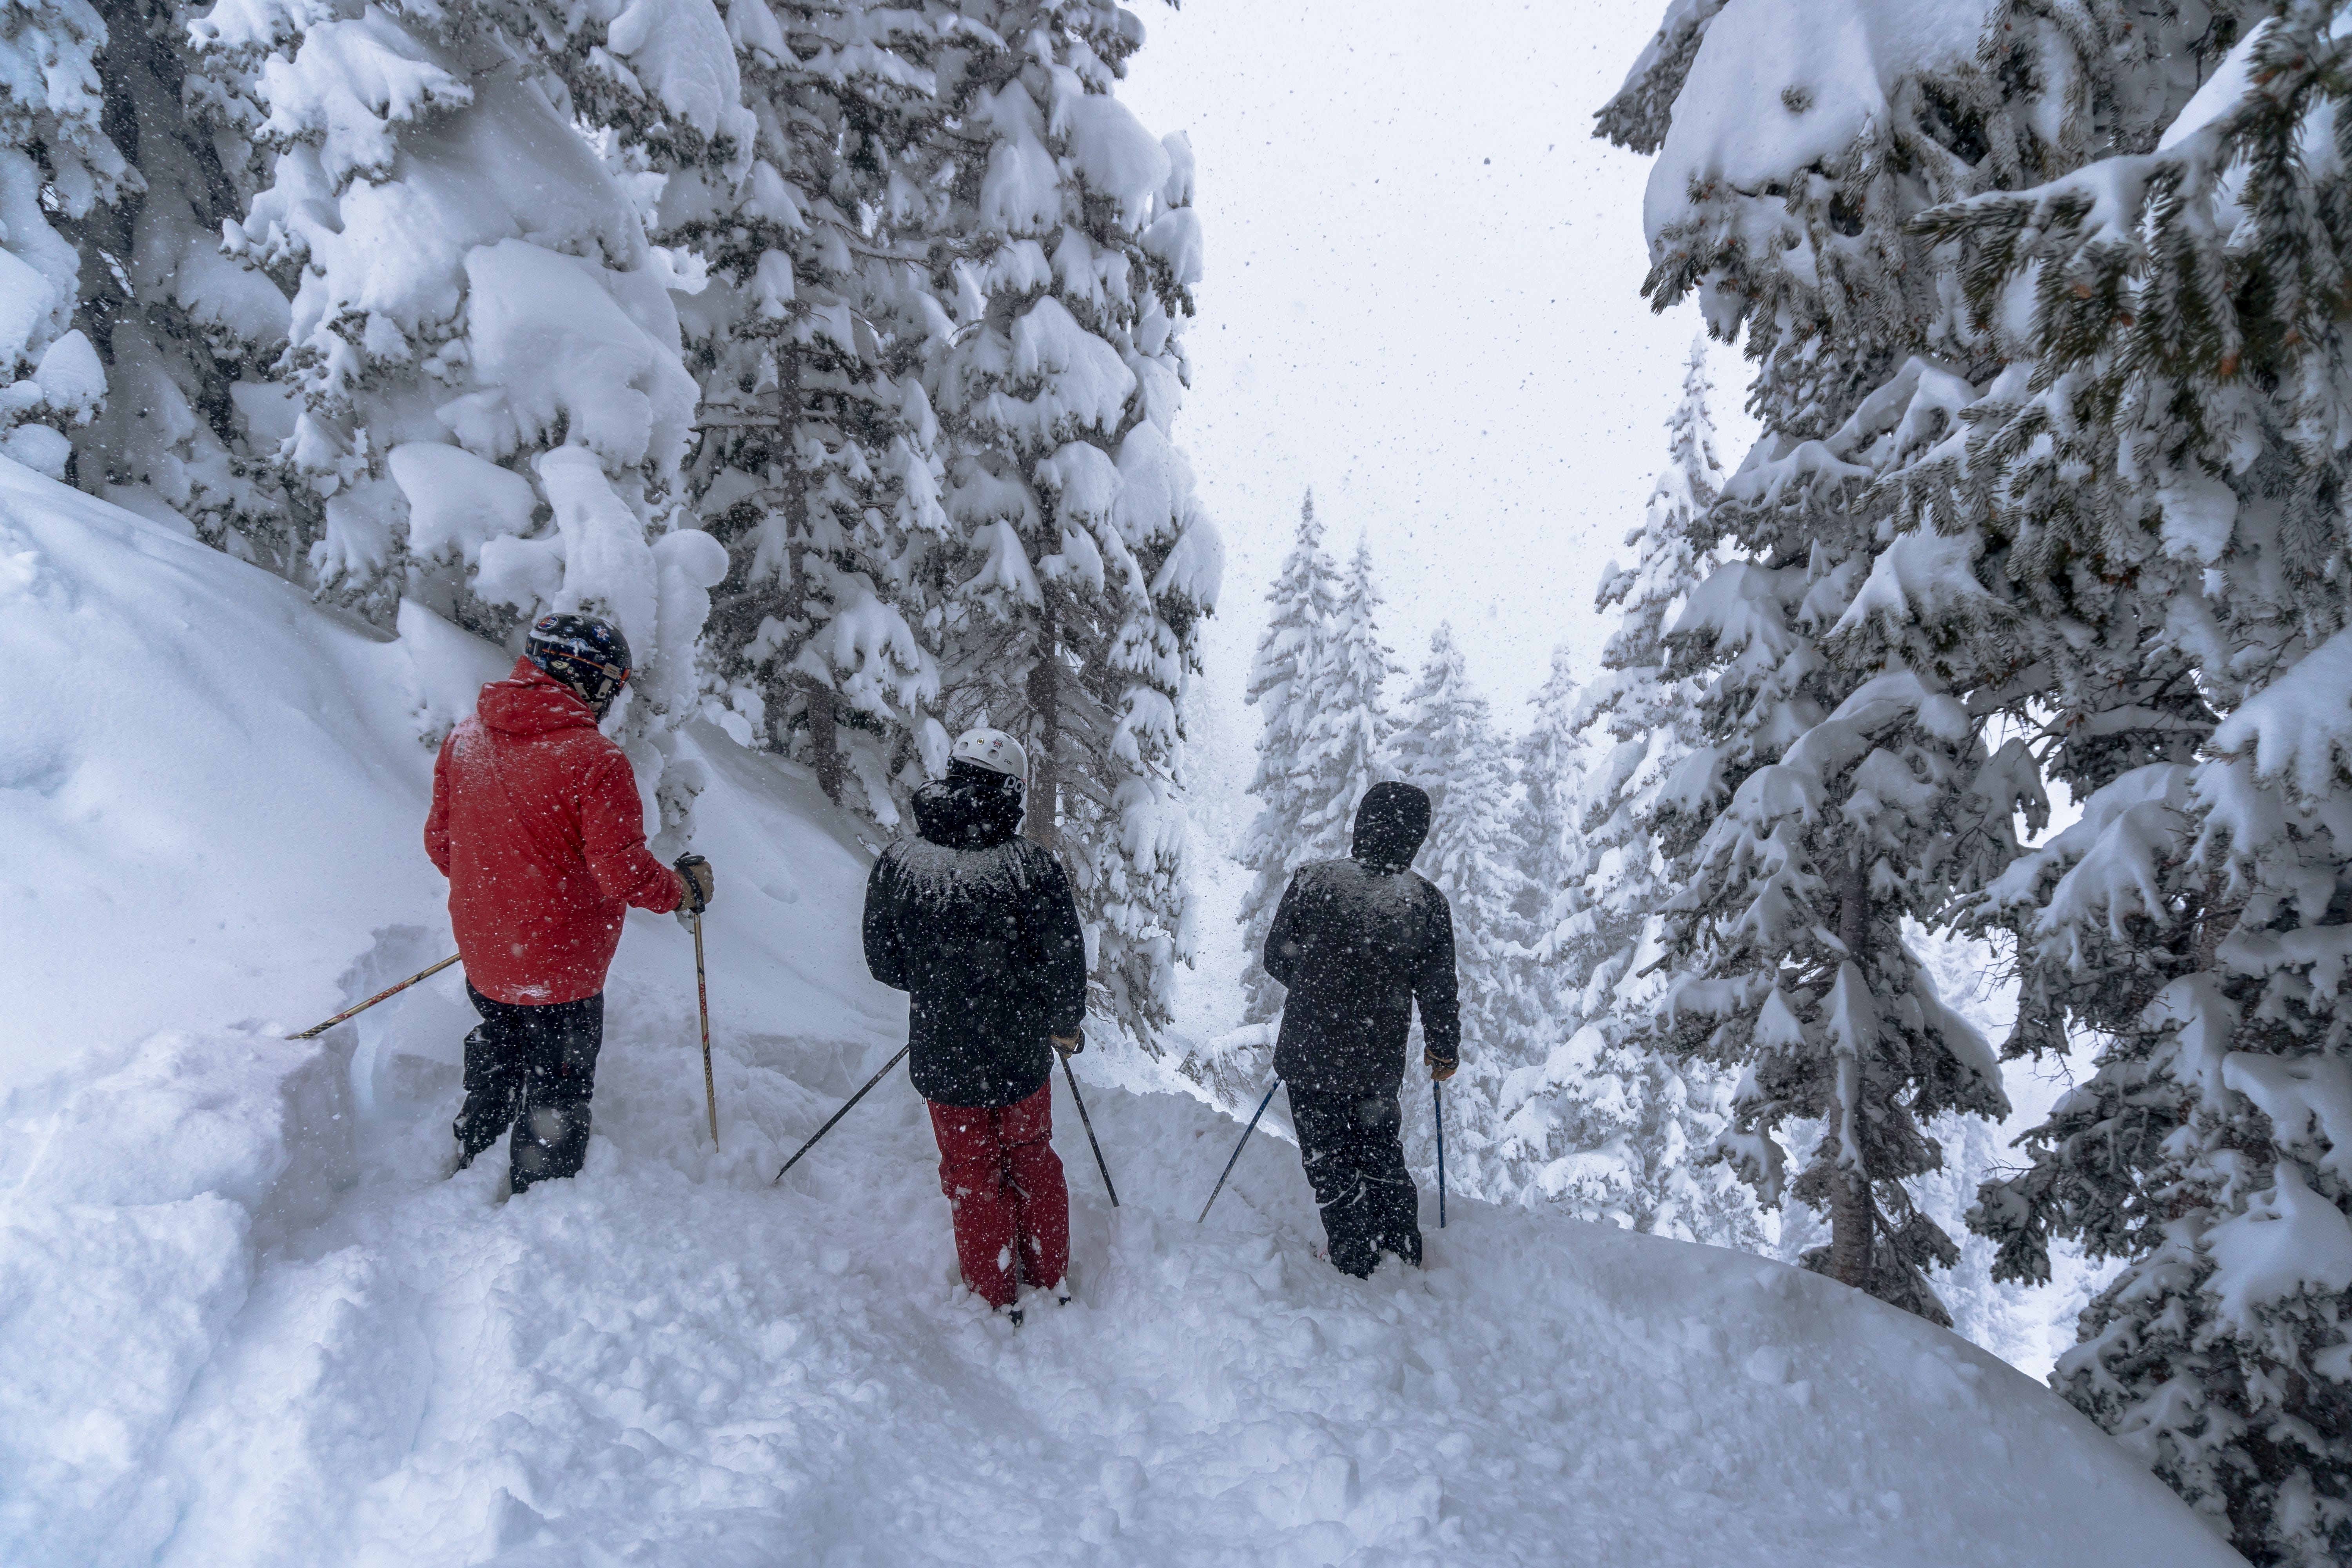
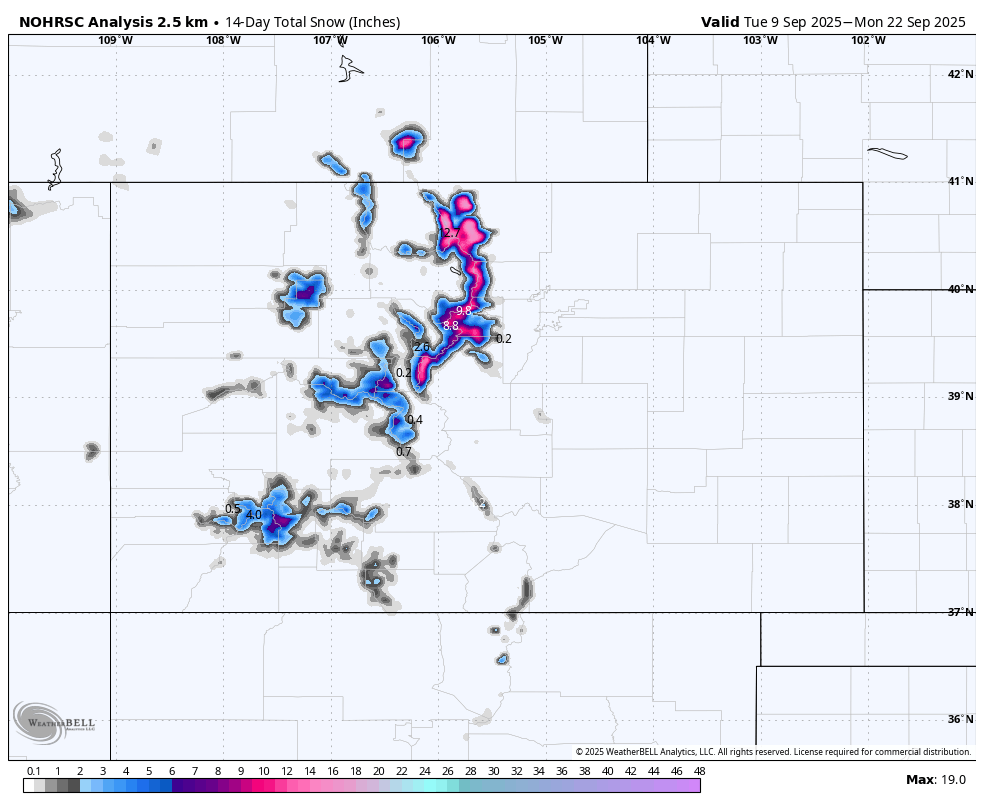
September snow
It’s not uncommon for Colorado’s peaks to see their first flakes of the season in September. We’ve had a couple of storms come through so far this month, coating some mountaintops in snow. Below are a few photos from Crested Butte, Loveland, and Breckenridge ski areas.
The new water year doesn’t start until October 1, so the accumulations shown in the map below will count toward the 2024-2025 season.