How this spring's snowpack is stacking up
No joke: April 1 readings were decent across many parts of the West, but some areas are still stuck in a snow drought
April 1 is a big day for fools, and for the West’s water professionals.
For the region’s water wonks, April 1 is a critical date for tracking snow accumulation and projecting the subsequent runoff that will fill streams, rivers, reservoirs, aqueducts, irrigation ditches, and the taps in homes and businesses.
Snowmelt accounts for most of the water flowing in key rivers such as the Colorado and Rio Grande, and while the annual snowpack tends to max out at different times throughout the vast region, many areas peak around early April. The April 1 map below shows how river basins fared in terms of snow water equivalent (SWE), a measure of the snowpack’s water content.
Overall, conditions were above normal in southern portions of the region, below normal in northern tier states, and about average in many of the remaining locations. The map makes full use of the colors in the legend, ranging from below 50% (red) to more than 150% (deep blue) of the median for 1991 to 2020. The north-south gradient is about what you’d expect from an El Niño, which tends to tilt the odds this way, as I discussed in an earlier post.
The maps below, from the ENSO blog at climate.gov, show how this winter’s precipitation differed from the long-term average (left) and the pattern that’s expected based on prior El Niños (right).

The post’s author, NOAA’s Nat Johnson, writes there was a “reasonably good match between what we saw and the expected El Niño precipitation pattern,” but he also notes some discrepancies: “the Pacific Northwest and Northeast were considerably wetter than the expected El Niño pattern, while portions of the southern tier from southern Texas to the Southeast were notably drier.”
How did the April 1 snowpack compare to previous years? I created the graphic below using data from 2022, 2023, and 2024.

At this time last year, the snowpack was huge in many parts of the West, and even record-breaking in some locations. This year’s map isn’t as blue, but conditions are better than they were in 2022, at least in most places.
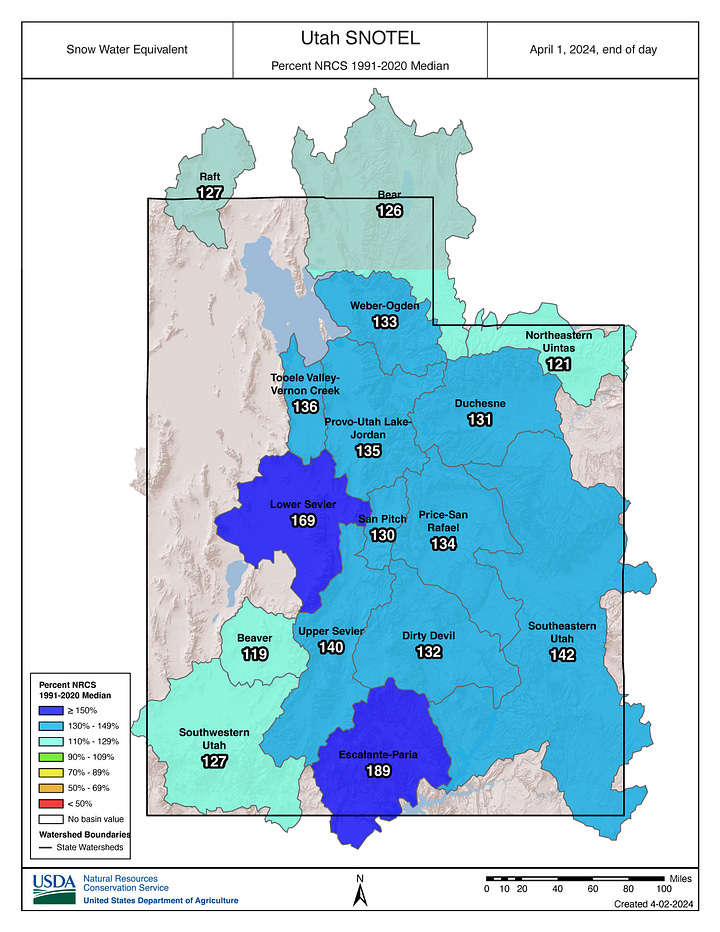
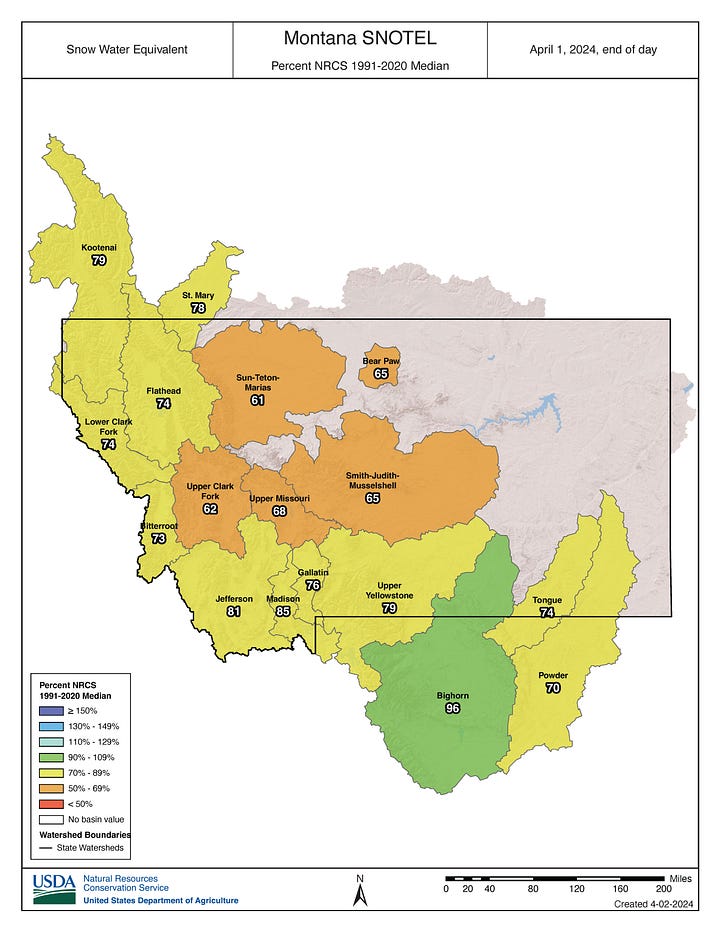
I took a glance at the April 1 snowpack maps for Western states (available here) and have included a few of them below:
Utah (looking good; I wish I hadn’t skipped skiing there this season)
Montana (grim, with record lows in some basins)
Idaho (wide range of conditions from north to south)
Colorado (about average and the headwaters of important rivers)
(Note: if you want to see full-sized images from this and other galleries, you’ll have to view the post on snow.news. Sorry, I’m at the mercy of the Substack gods.)


It’s worth remembering that in a state like Colorado, where the snowpack supplies water to 18 other states and Mexico, the weather in April and May can play a major role in determining streamflows and reservoir levels.
In the April 4 chart below, the black line shows actual snowpack levels in Colorado since October 1, 2023, and the solid green line indicates the median from 1991 to 2020. Looking into the future, the dashed lines show a variety of possible trajectories for the snowpack in the months ahead. The dark blue and dark red lines plot the maximum and minimum projections, respectively.
Although it’s highly unlikely, the chart above shows that moving forward, the state’s snowpack could plummet and be significantly below average by May 1. Alternately, if we get hit by a bunch of storms and it stays cool, the snowpack could keep on growing into May. In other words, the story of this season’s snowpack is still in flux.
In recent years, snowpack levels in the Rockies that were around normal on April 1 have translated into below-average streamflows. Some scientists have pointed to deficits in soil moisture as the culprit for the disparity. Others are researching how warming temperatures are impacting sublimation, when snow converts directly into water vapor. A 2023 paper from Colorado State University scientists argued that spring and summer precipitation was important for explaining the discrepancy between snowpack levels and subsequent runoff.
In California, the snowpack was a mere 28% of normal on January 1, but all of those atmospheric rivers and other storms wound up delivering a statewide estimate of 110% on April 1. Recent headlines have used phrases like “unusually normal” and “average is awesome” to describe the conditions in California, where the April 1 snowpack in 2023 was 232% of normal but just 35% in 2022. The April 3 graphic below shows the northern part of the Sierra Nevada has the deepest conditions.
In a sign of the snowpack’s significance, California Gov. Gavin Newsom used the April 1 milestone as a news hook for announcing a new water plan for the state. “Newsom wore snowshoes as he joined state water managers for their final snow survey of the season,” wrote Ian James of The Los Angeles Times. “The snow was more than 5 feet deep at Phillips Station near South Lake Tahoe on Tuesday. Officials noted that nine years ago, then-Gov. Jerry Brown had stood on snowless ground at the same spot and declared a drought emergency.”
If you’d like to see interesting and detailed maps of the Sierra snowpack, check out this page from researchers at the Institute of Arctic and Alpine Research at the University of Colorado Boulder. These experimental products provide “near-real-time estimates” of SWE at a resolution of 500 meters (1,650 feet, or about 0.3 miles). They’re based on recent cloud-free satellite imagery and on-the-ground data from snow pillows and other sources.

Elsewhere in the West, warm and dry conditions have persisted in places such as Washington, Montana, northern Idaho, and much of northern Wyoming, with some SNOTEL stations reporting record-low SWE readings, according to an April 3 snow drought update from drought.gov.
On the bright side, “an active March storm track favored the Sierra Nevada, central Great Basin, and Four Corners states, where little snow drought remained by the end of March,” the update said. For the second year in a row, the April 1 snowpack was above normal in the Upper Colorado River Basin, which is crucial for filling the beleaguered Lake Powell and Lake Mead.
Around home, my own private snowpack, located at 7,600 feet on the north-facing side of my house, where the roof casts off its accumulation, continues to dwindle and ablate toward oblivion. Here in southwest Colorado, the snowpack high in the mountains eventually caught up to around normal, but I must say that the conditions at Purgatory felt subpar for most of the season. At lower elevations, some of the storms that were connected to atmospheric rivers came in warm and dropped rain or mixed precipitation, so I did way less shoveling and snowblowing this winter, which I lament, strangely enough.
It’ll be interesting to see how the rest of spring plays out. I’ll confess that I’m a little sad that snowfall season is nearing its end and my days of skiing are numbered. After 32 days on the hill, 404 runs, and 513,168 feet of vertical, I’m not yet satisfied. But there are still more turns to be enjoyed, and I am getting excited about other activities, such as biking, hiking, paddling, and camping.
By the way, I’ll continue to publish as the weather warms, moving my base of operations this summer to an isolated ski hut in the Andes with stunning views of Aconcagua, where I’ll report on snow conditions in the Southern Hemisphere.
Actually, that’s a belated April Fools’ joke, but snow.news is a year-round operation. As the snowpack becomes a memory and I trade ski pants for shorts, I look forward to delving into snow science, writing about snow on other celestial bodies, exploring the role of snow in warfare and human history, plus plenty of other timeless topics.


