Snowpack update
Plus: H is for hydrologic cycle graphics

“Abysmal” and “exceptional” are some of the words that drought experts recently used to describe the lack of snow in Arizona and New Mexico.
Since that March 6 report, some desperately needed snow (and rain) has fallen in the Southwest, so conditions have improved slightly, but for the snowpack, it looks like a case of too little, too late.
The map below is a slightly different version of one that I regularly share. Rather than illustrate the state of the snowpack in snow water equivalent, this March 15 map shows precipitation since the start of the water year on October 1.
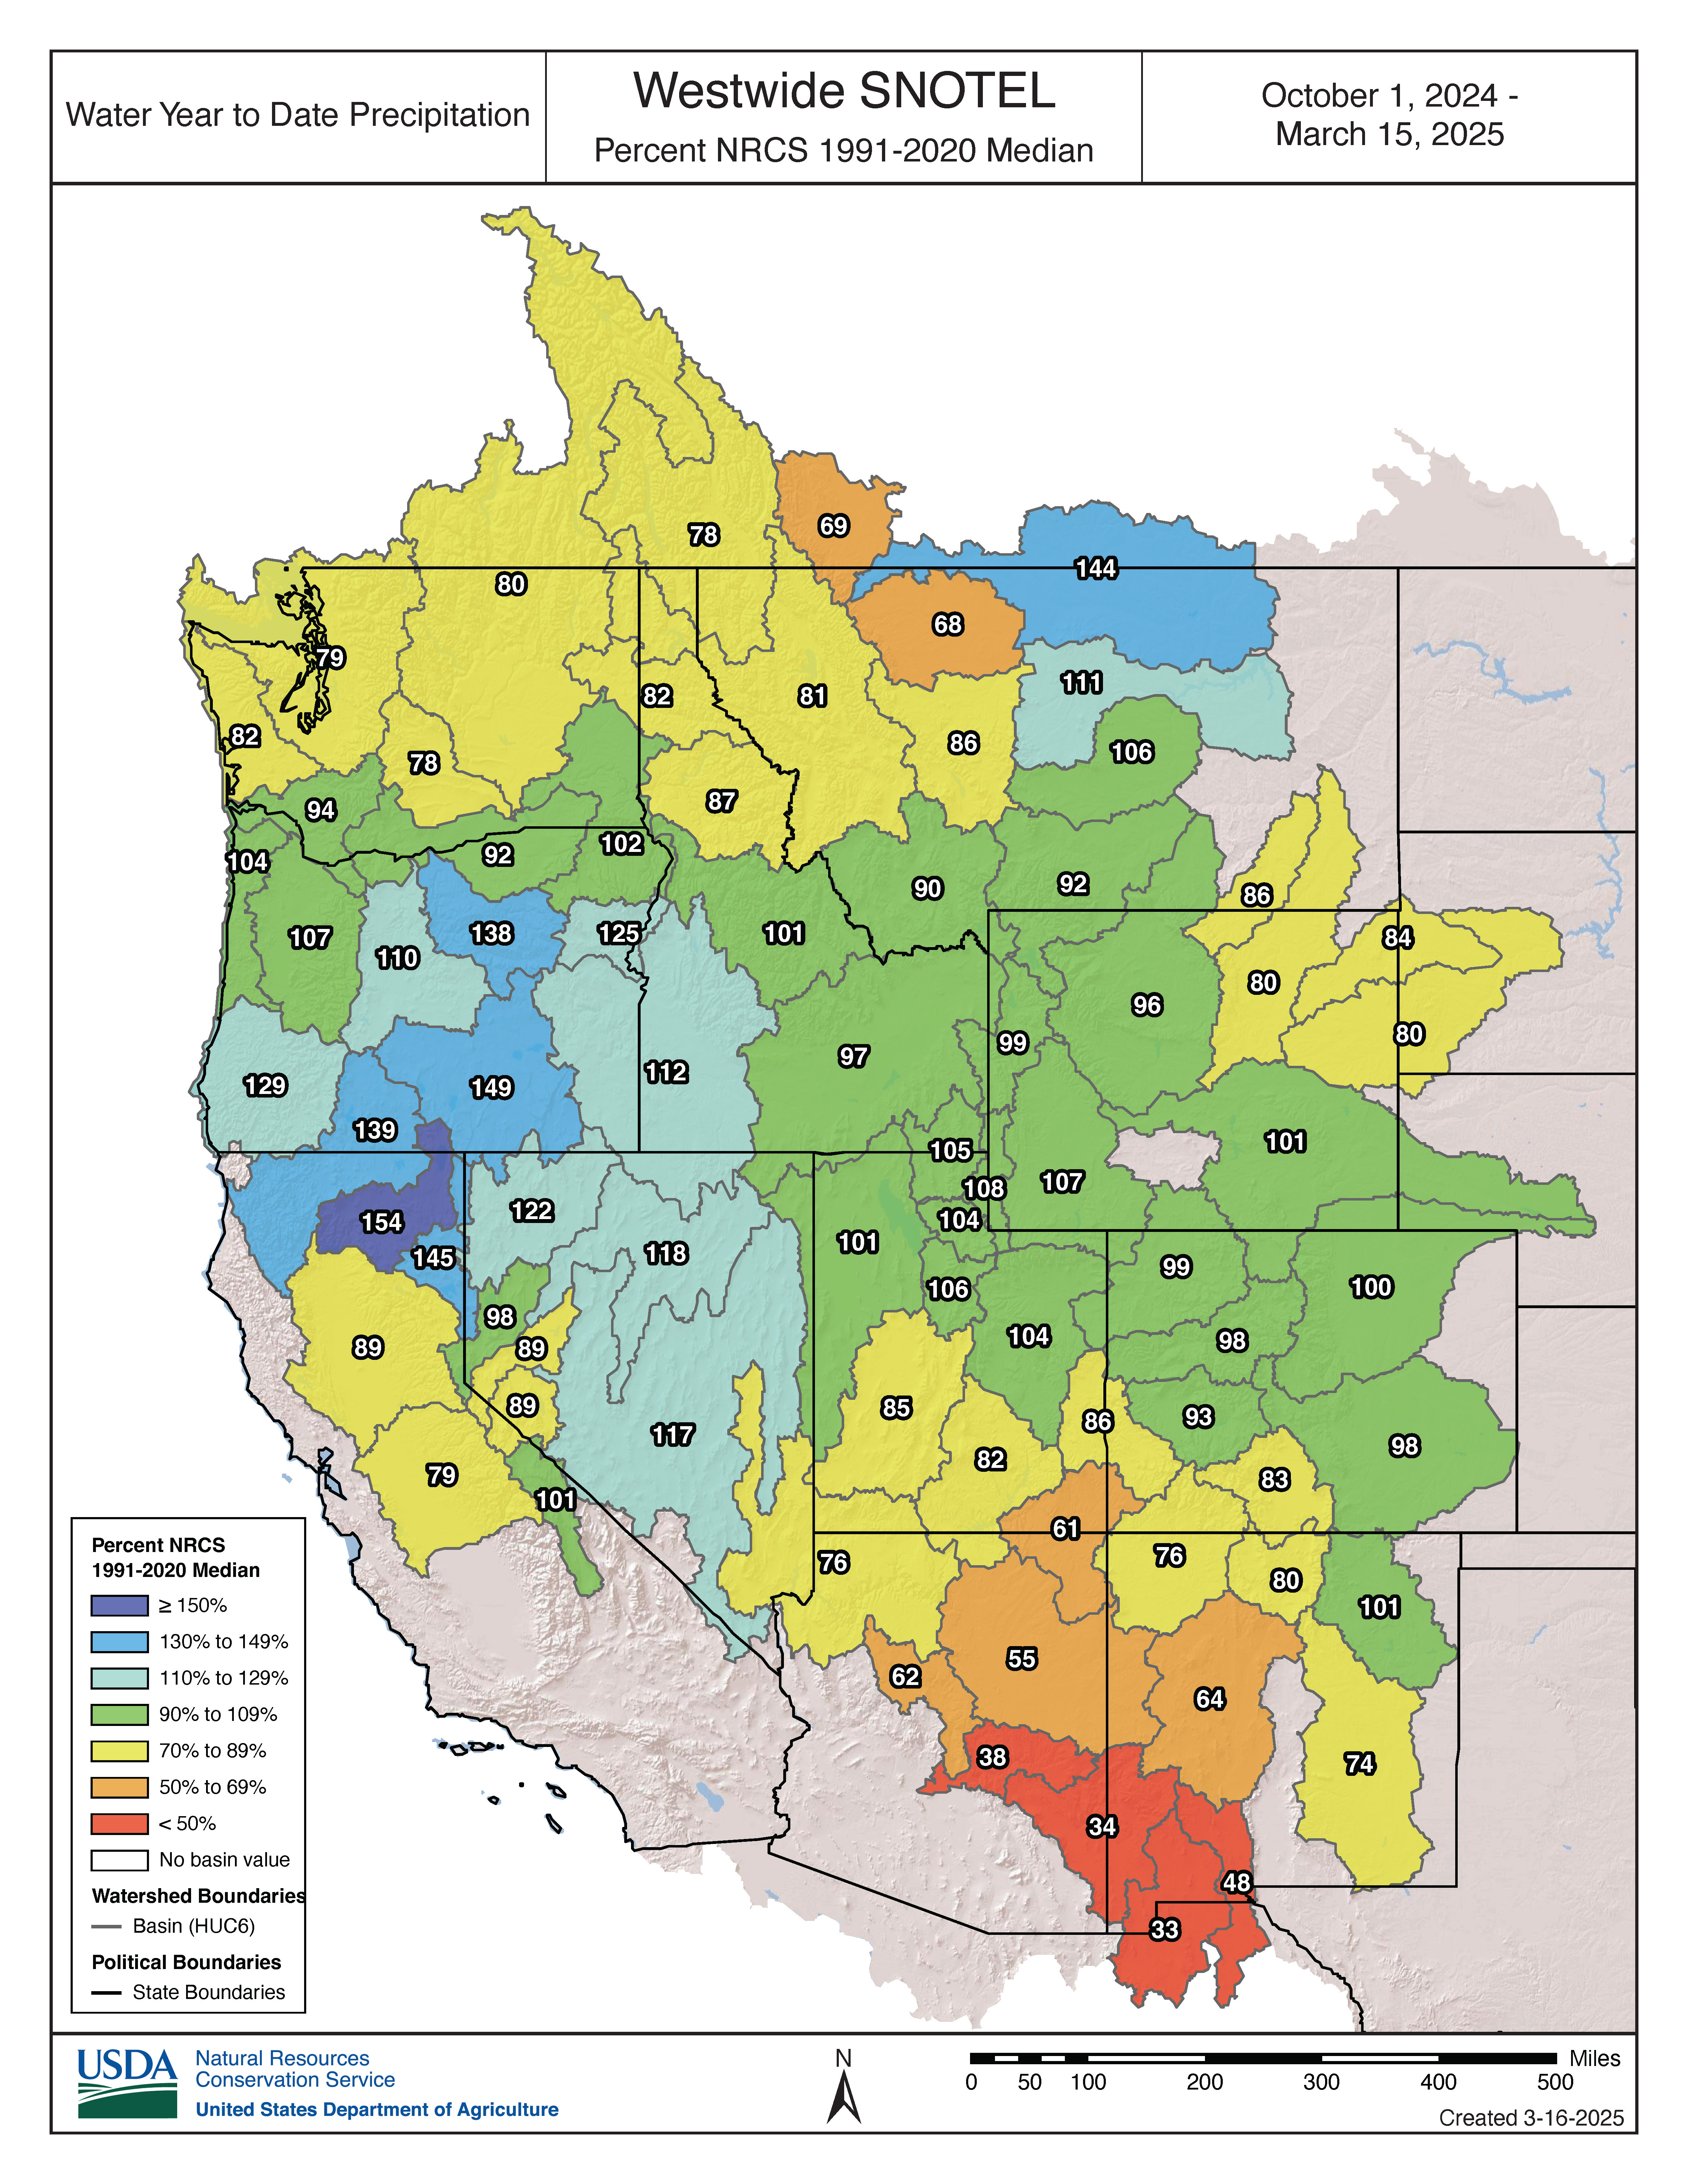
Even after the recent storm cycle, there’s a lot of orange and red in Arizona and New Mexico, plus plenty of yellow in surrounding portions of southern Utah and Colorado.
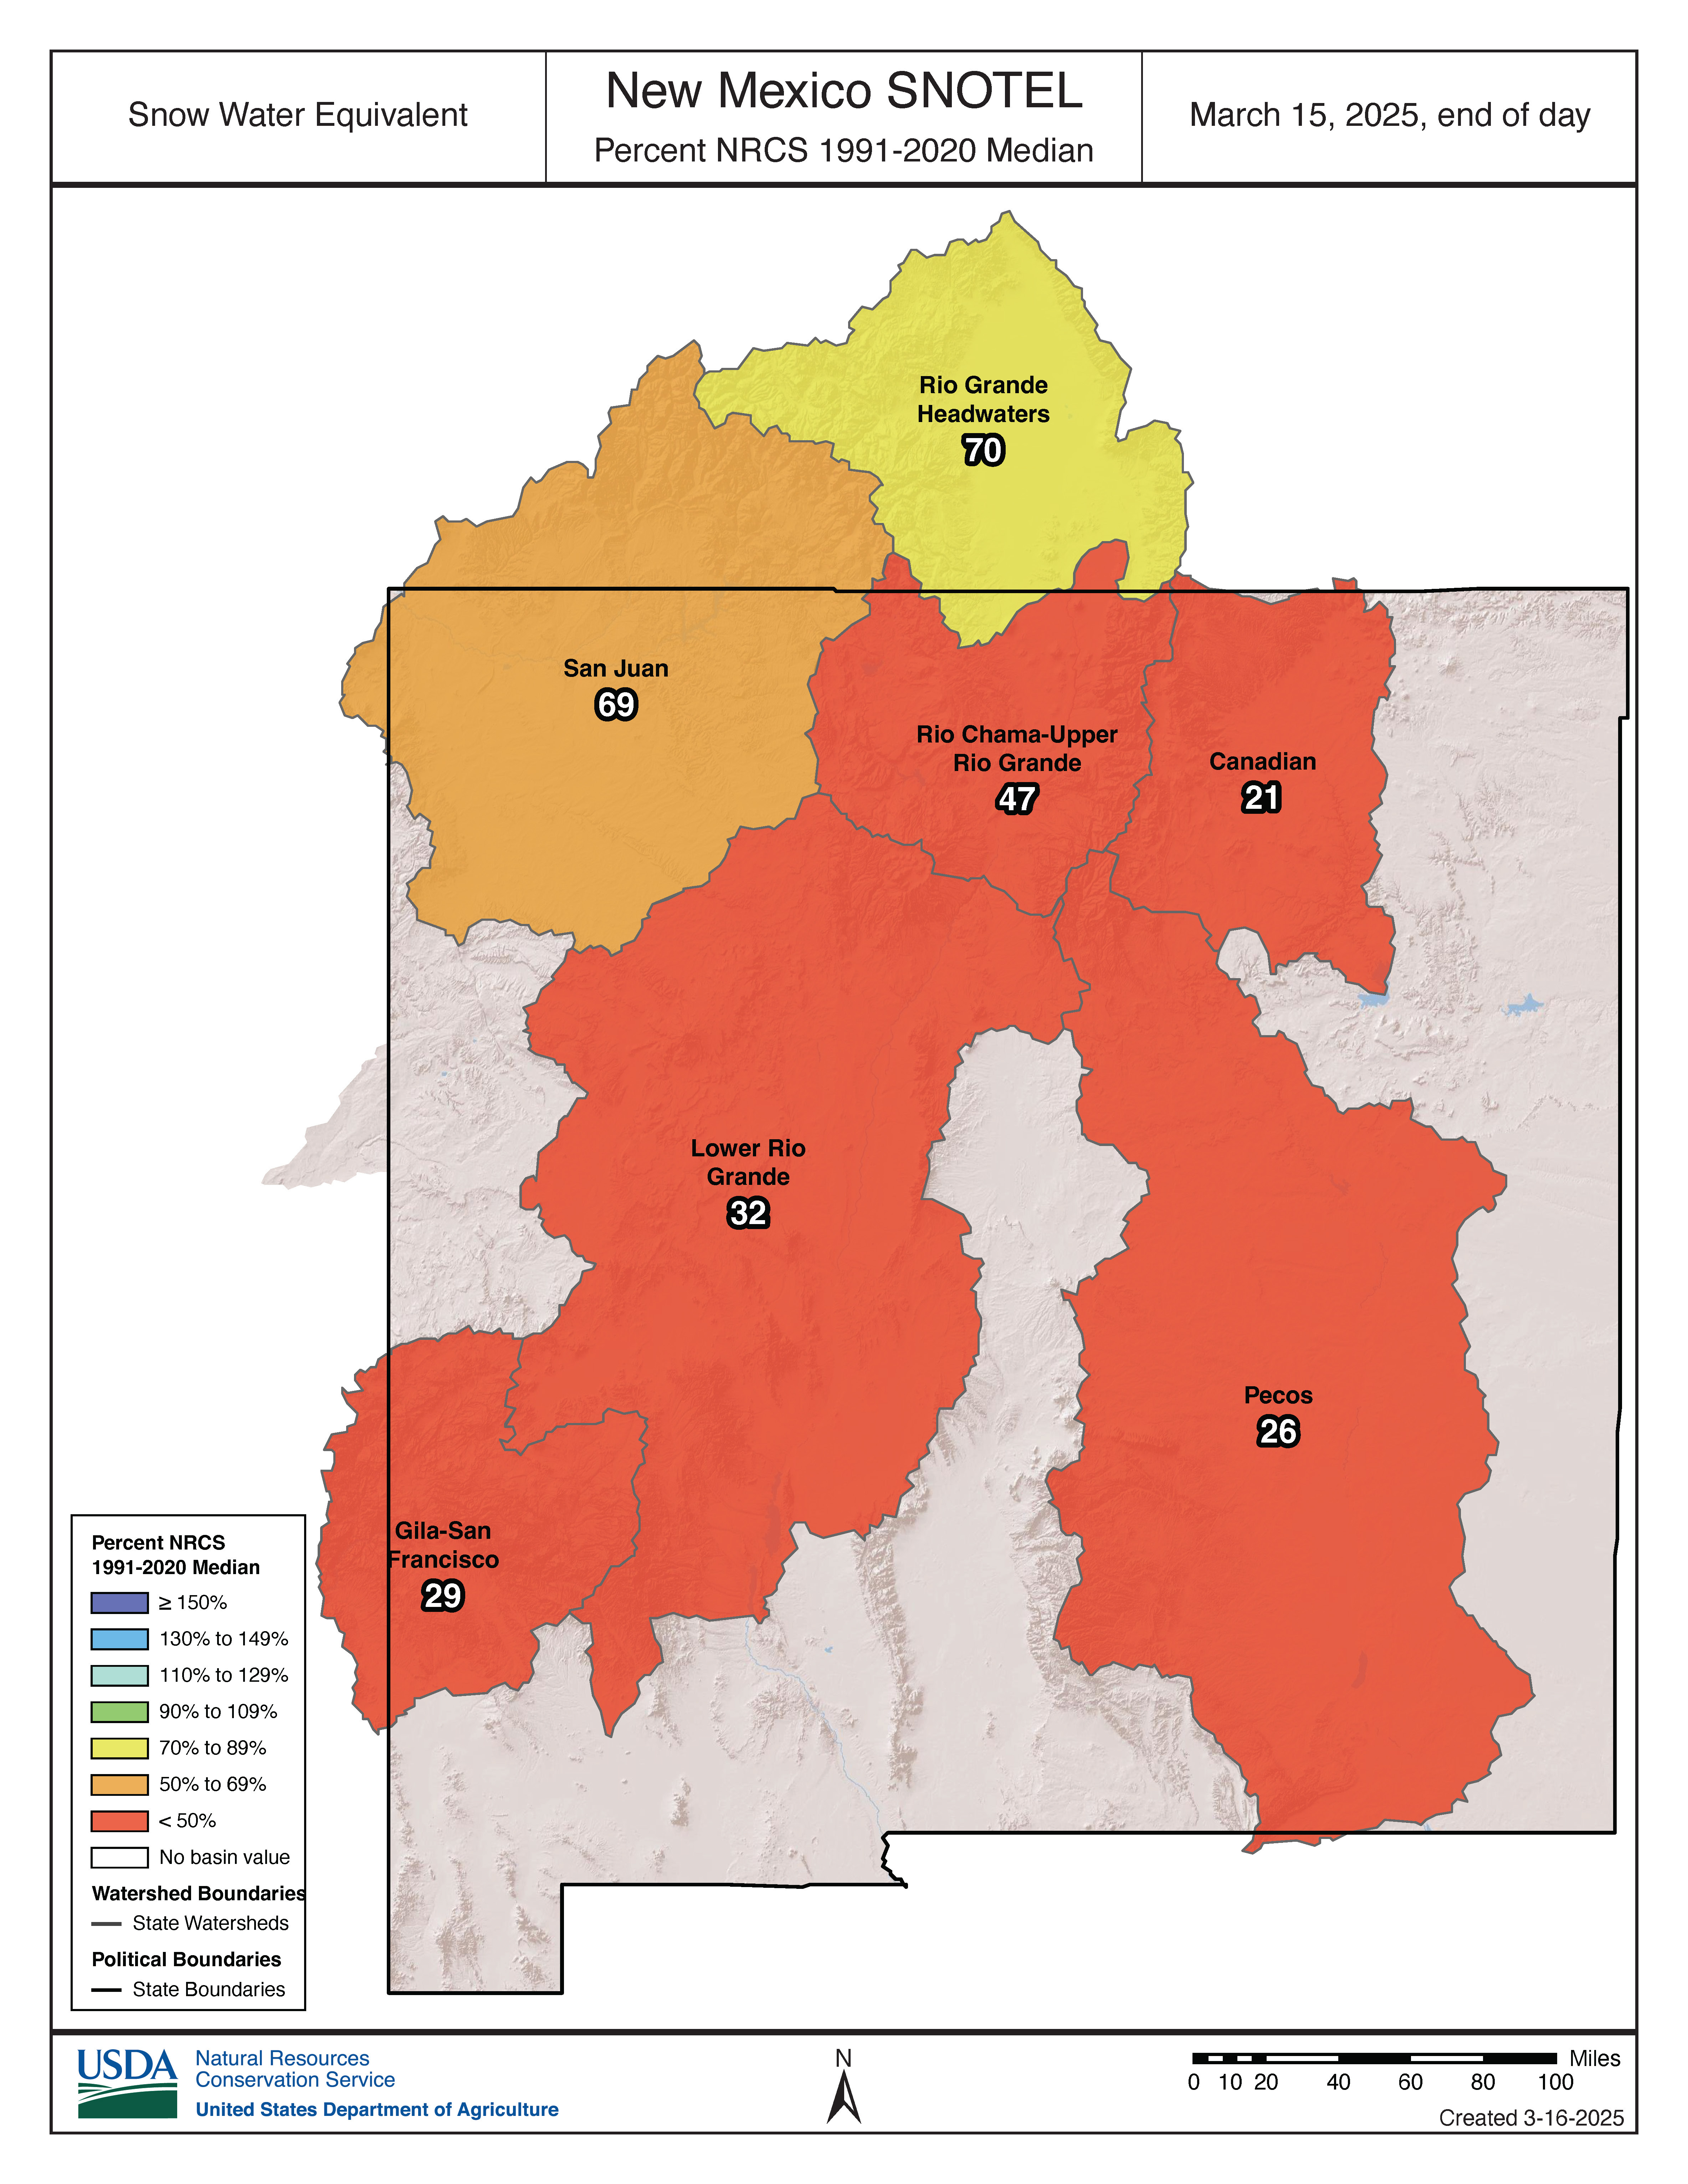
Below is the more familiar map of the snowpack. It shows the same general patterns, but there are some surprises . . .
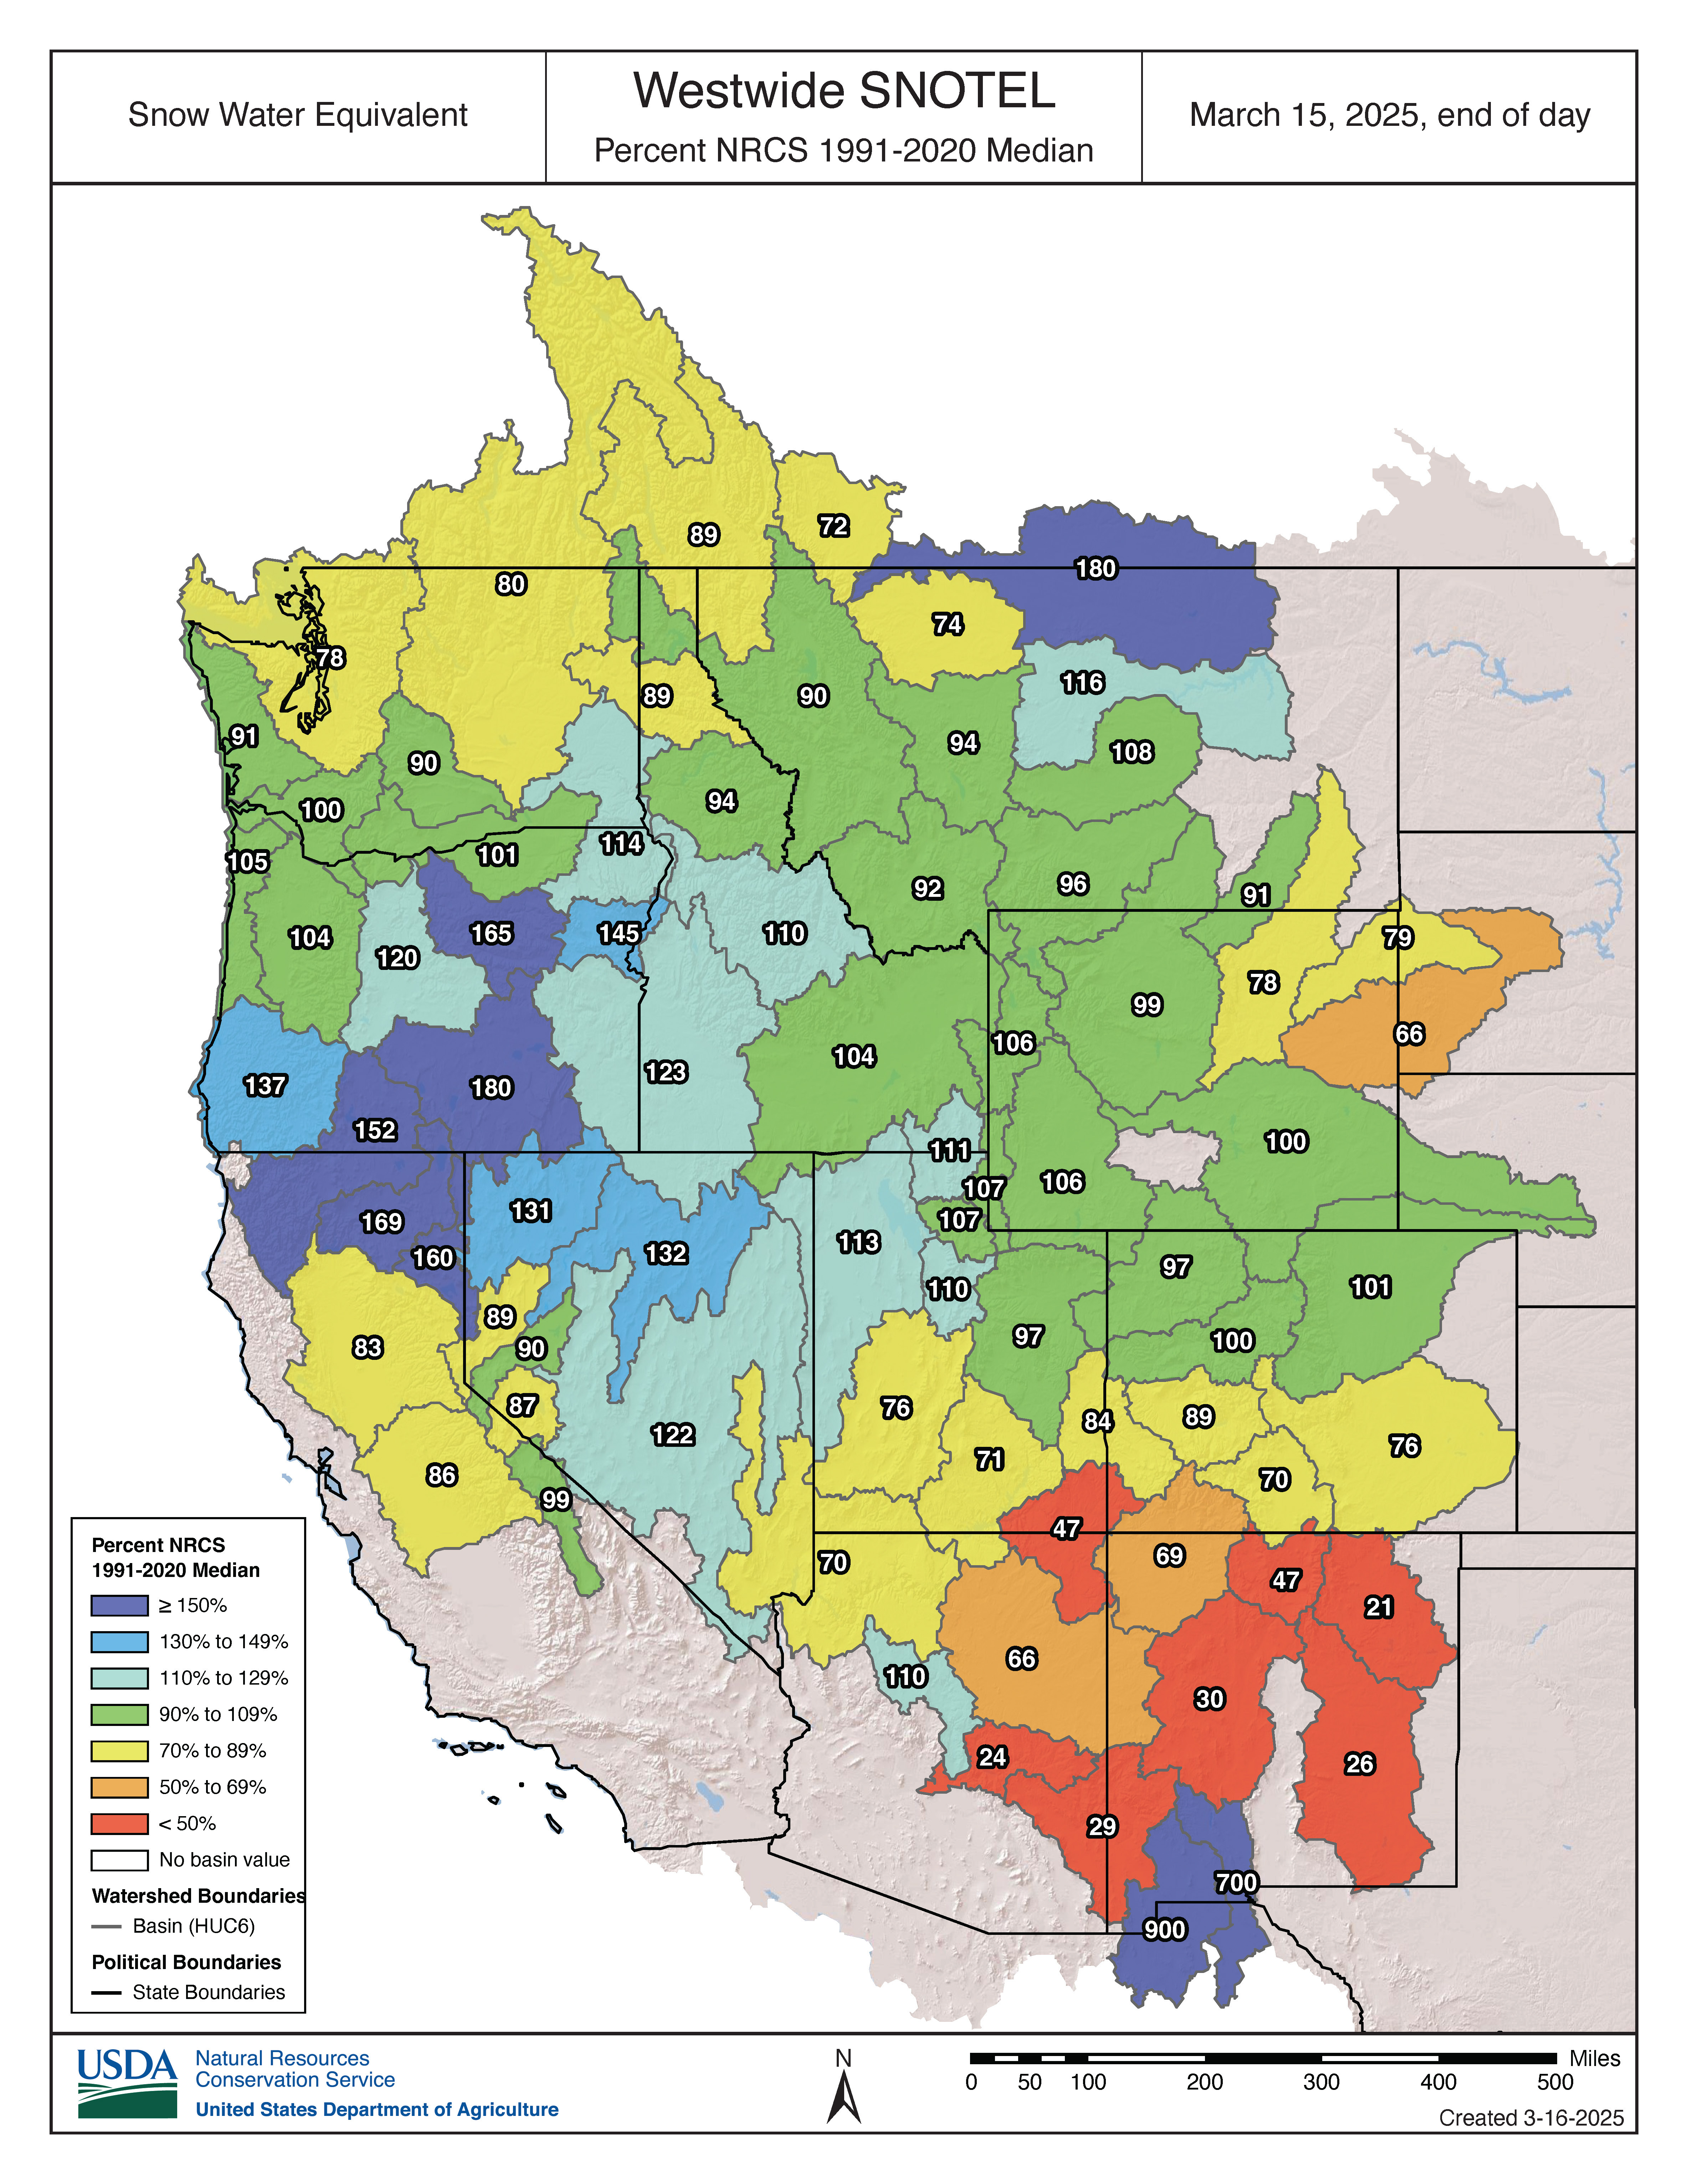
. . . such as the deep blue outliers you may have noticed in southwest New Mexico, with stunning readings of 700% and 900% of normal!
Before you head down there to shred some gnar, let me caution you that at the end (and beginning) of the snowpack season, such deceptive anomalies start to crop up on these otherwise useful maps. Why? Because the median snowpack for the date is so tiny, any accumulation will cause the numbers to skyrocket.
To drill down a bit, the black line in the chart below shows the relatively small spike in the snowpack in the Mimbres River watershed in southwest New Mexico, which helped turn the shading in the map above deep blue. Yes, the 0.4 inches of snow water equivalent really is 900% of the median (green line), but we’re 38 days past the typical peak date for the snowpack, so there’s usually almost no snow around this late in the season.

Zooming out, the map below shows the situation in New Mexico and southern Colorado: it’s definitely going to be a down year for runoff on the Rio Grande.
Turning to the Colorado River Basin, federal forecasters projected on March 17 that April-July runoff into Lake Powell would be just 70% of normal. In the graphic below, the triangles are shaded according to their forecasted flows, and the table provides details on some tributaries.
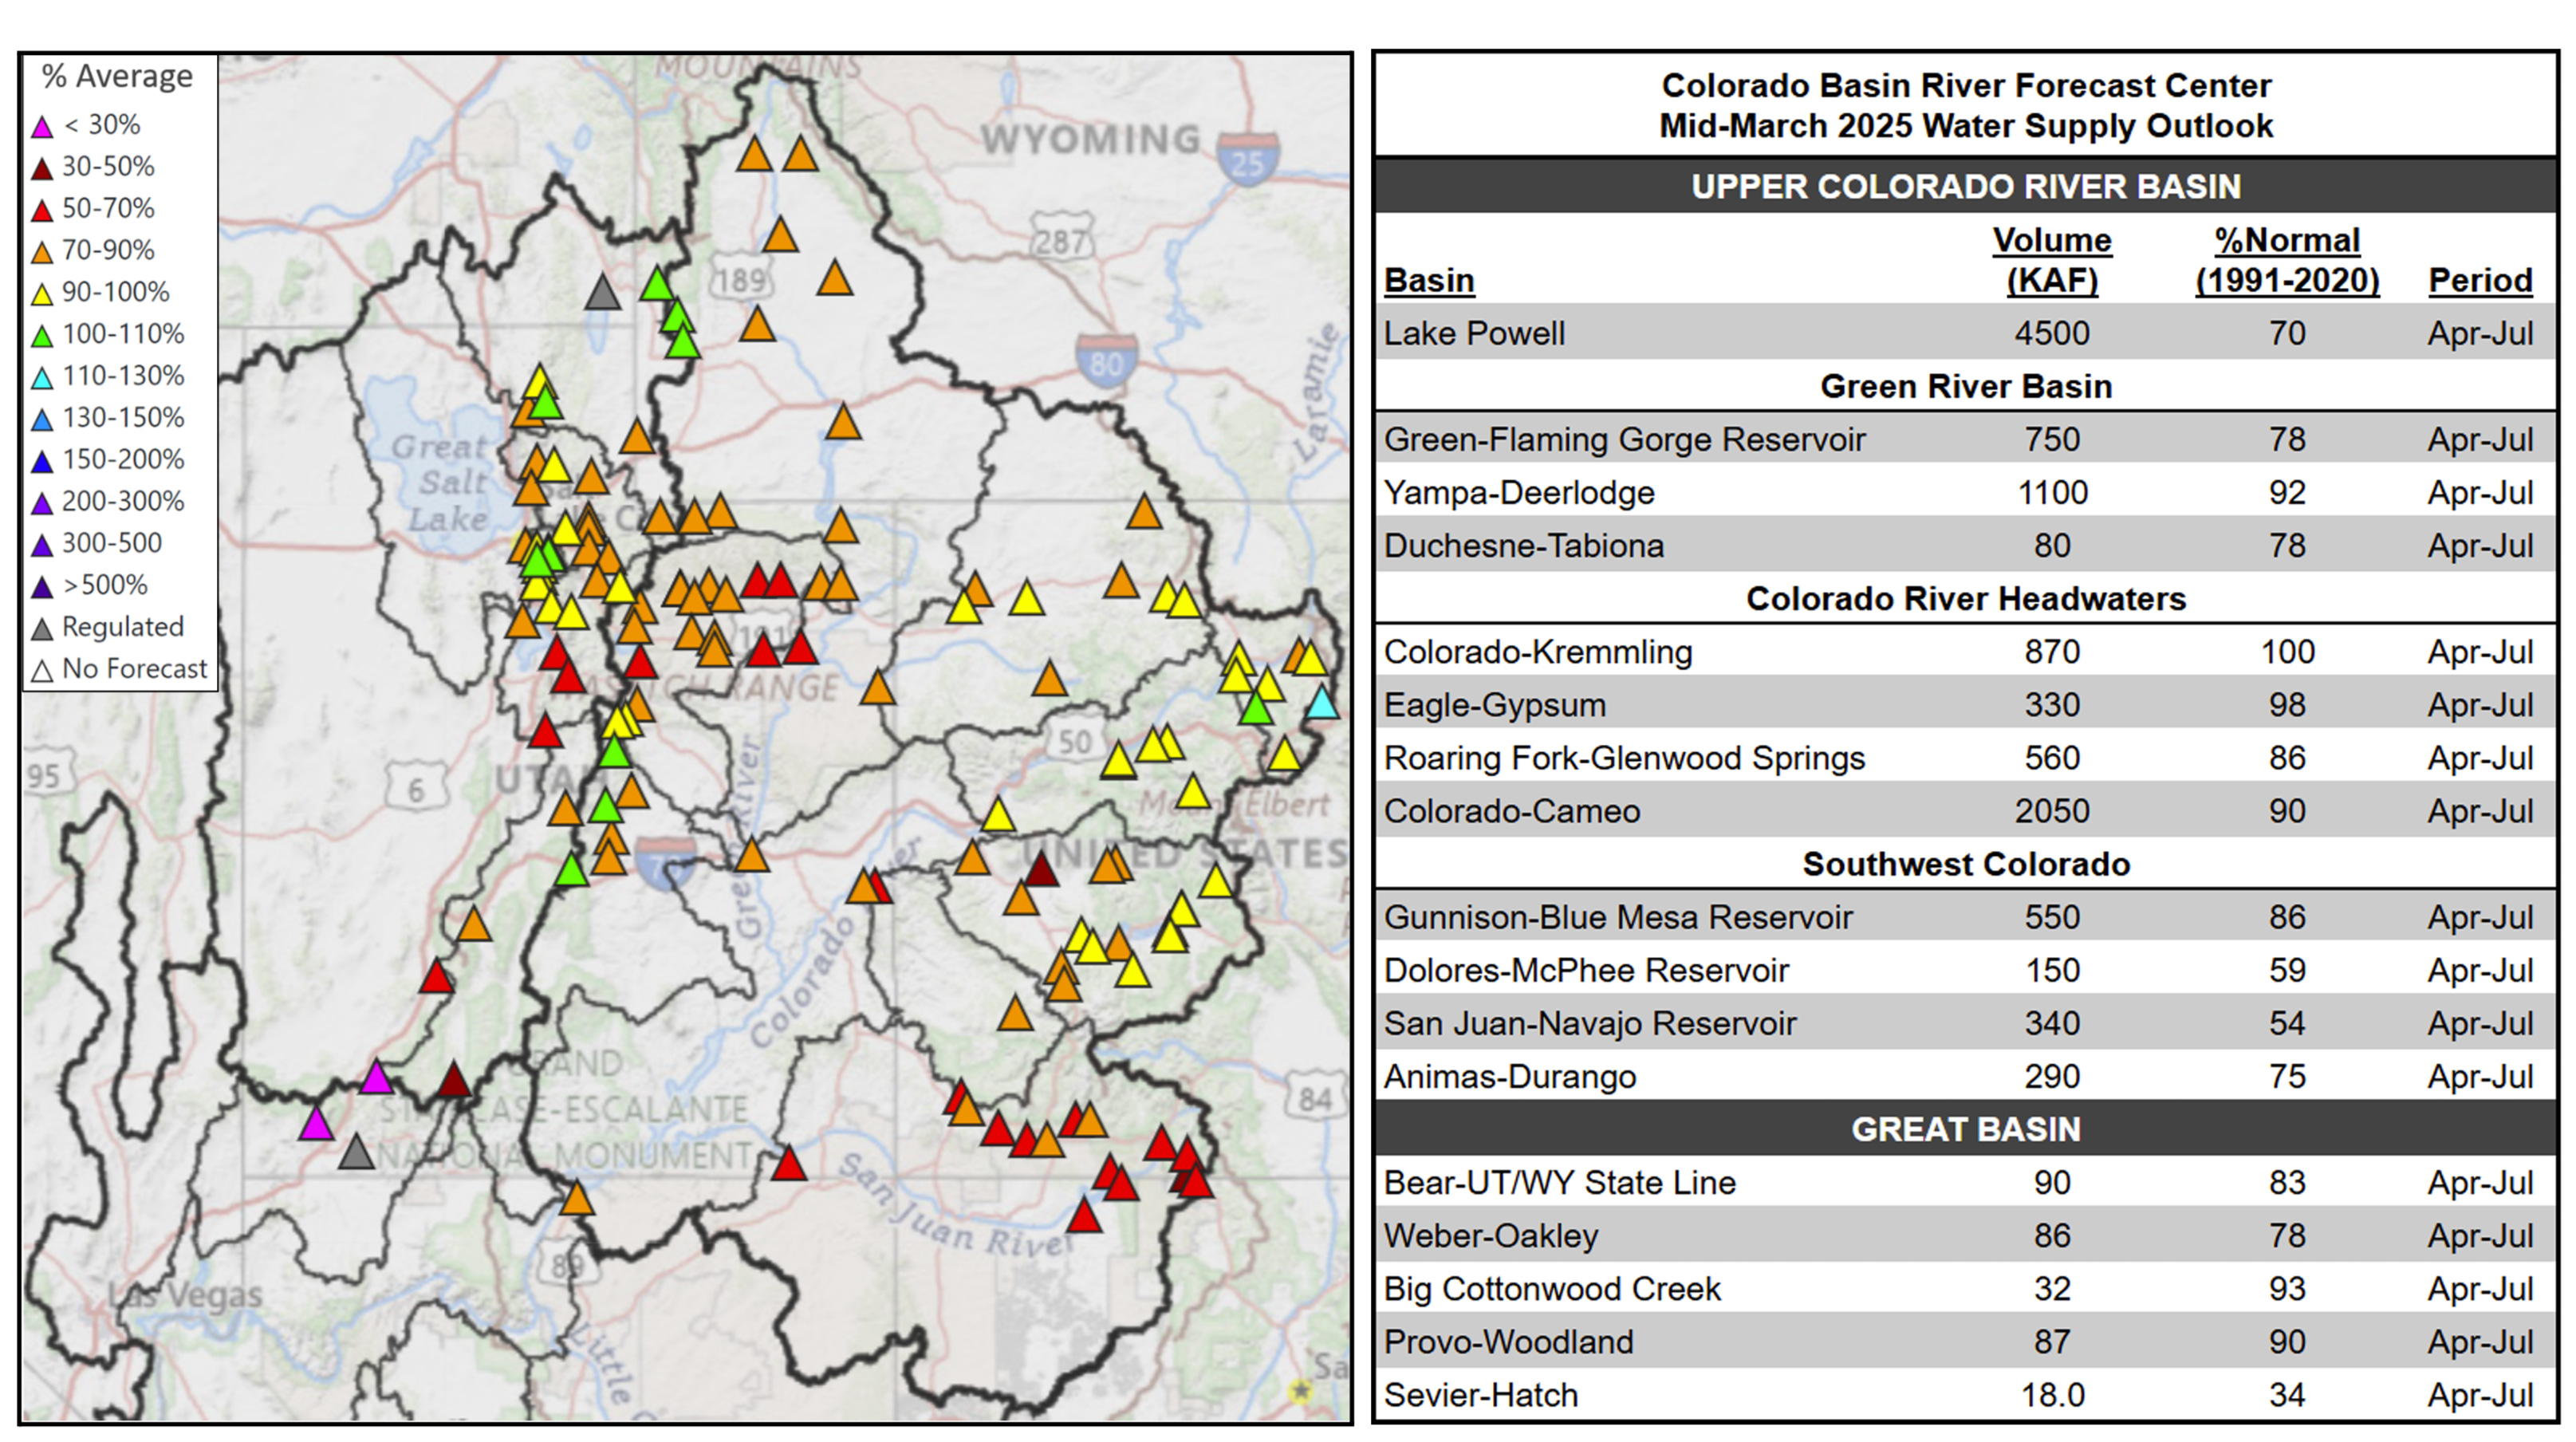
Although snowpack conditions and the runoff forecast are near normal in the Colorado River’s headwaters, it’s another story in other parts of the watershed. Here in southwest Colorado, the Dolores and San Juan rivers are at just 59% and 54%, respectively. In the Lower Colorado River Basin, “while March has seen a wet start, the season as a whole remains historically dry,” according to the river forecast center.
In California, the Sierra Nevada’s snowpack got a boost recently, but overall, the statewide snowpack is at 92% of normal, as shown in the graphic below.

If you’re curious about conditions around your home, I’d encourage you to check out this interactive map from the High Plains Regional Climate Center. It’s an excellent source for climatic data with a simple interface.
I used the site to create the graphics below for precipitation and temperature since the start of the water year on October 1.


SnowSlang: H is for “hydrologic cycle”
I’m a big fan of the hydrologic cycle—and diagrams that explain the essence of life on our planet. The water cycle, as it’s also known, drives weather, climate, erosion, and ecosystems, so it lies at the heart of both our modern, daily existence and the deep, geological history of our planet.
I’ve long been fascinated by the fact that the volume of water circulating on today’s Earth is essentially static: it’s basically a closed system. For billions of years, the H2O has been getting recycled through various phases and locations over and over and over.
(Technically speaking, relatively small amounts of water enter and exit the system: water molecules are lost to space when they break up high in the atmosphere; comets and meteorites continue to deliver water from beyond Earth; and geological processes cause water to be created/sequestered through volcanic activity and subduction zones.)
When it came time for me to start my own consulting business in 2014, I chose the name Sea to Snow, in part due to my focus on water issues and the hydrologic cycle, but also to recognize my own migration from a maritime upbringing on Long Island to a more snowy existence in Colorado.
In the spirit of “a picture is worth a thousand words,” I wanted to share some examples of hydrologic cycle graphics that I’ve found helpful in explaining Earth’s water. (If you need a refresher on the terminology, check out the snow-related glossary I recently created for The Water Desk.)
Below are three diagrams illustrating the water cycle, all from the U.S. Geological Survey (click to enlarge).

 and how it moves (with arrows). Human activities are shown throughout.")

I also found the simple diagram below from the National Oceanic and Atmospheric Administration and its National Weather Service.

Given the recent cutbacks and deletions at federal science agencies, I can’t promise that these links will continue to work!
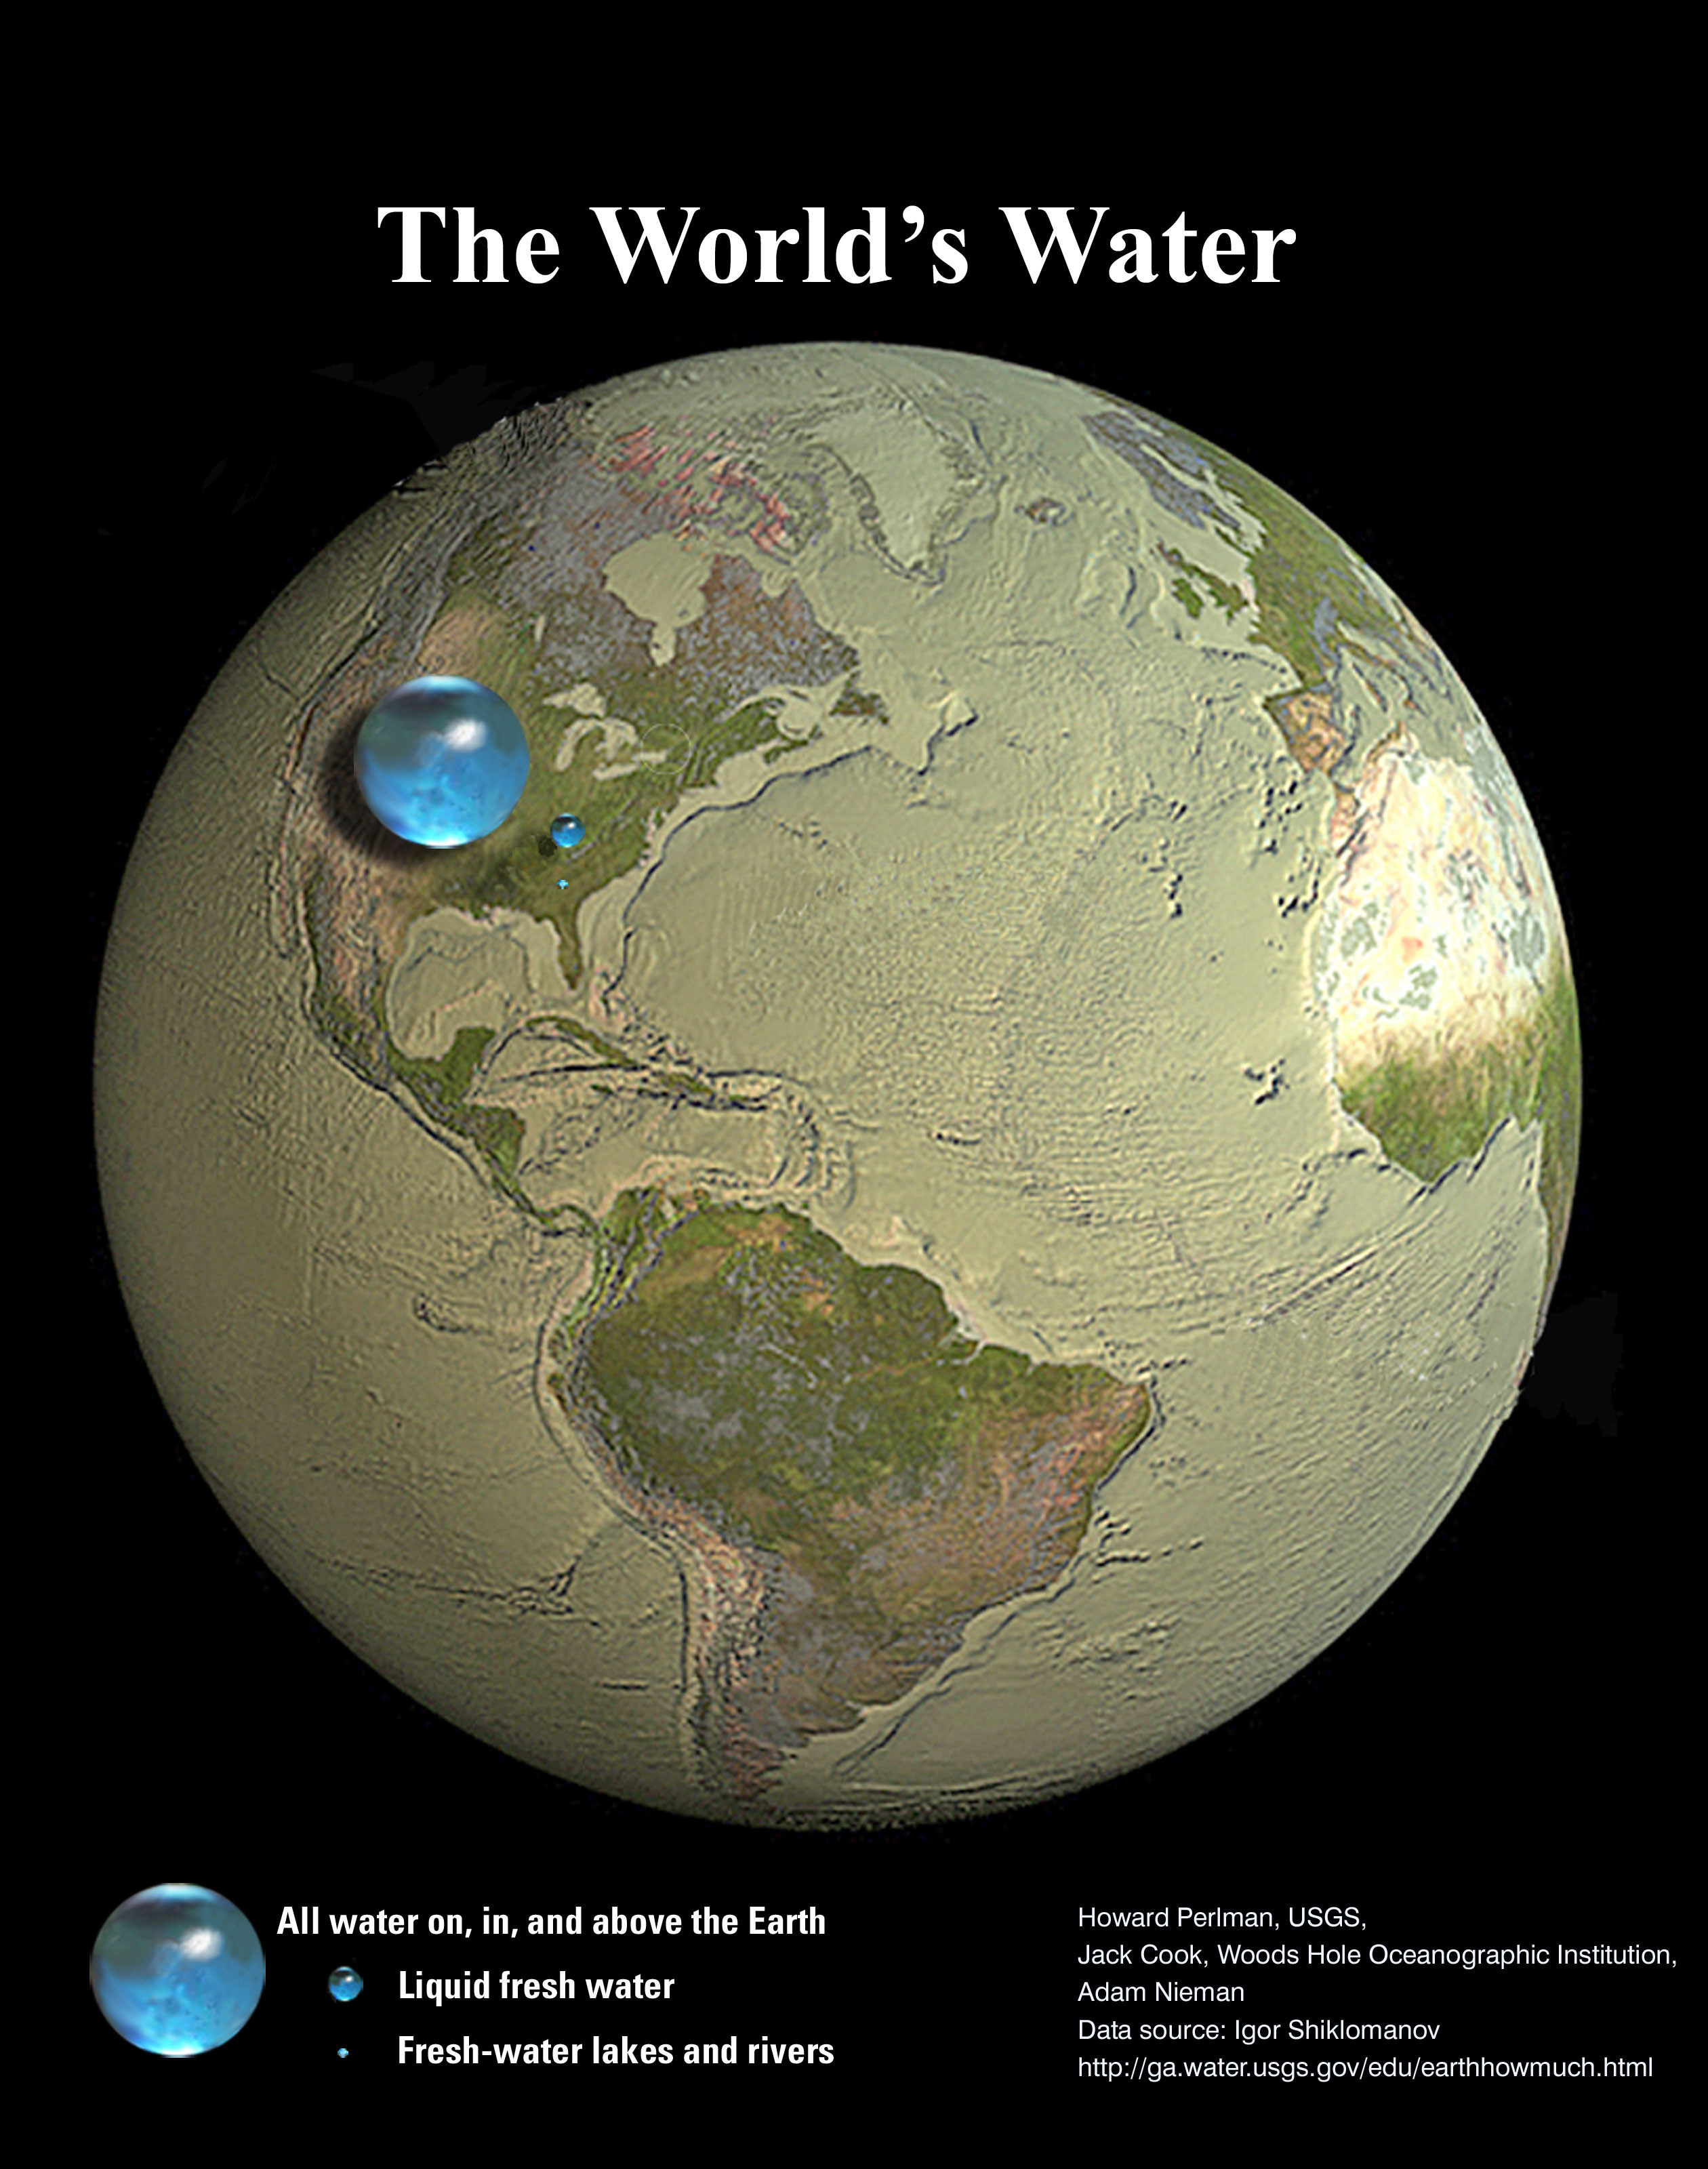
Although water covers about 71% percent of the Earth’s surface, it’s a relatively thin layer, and the fraction that’s freshwater is minuscule.
The graphic below visualizes the volume of water on Earth in a series of spheres: the largest one over the United States shows all of the water on, in, and above the Earth; the much smaller sphere over Kentucky represents all of the planet’s liquid freshwater; and the tiny dot around Atlanta is equivalent to the volume of all lakes and rivers.
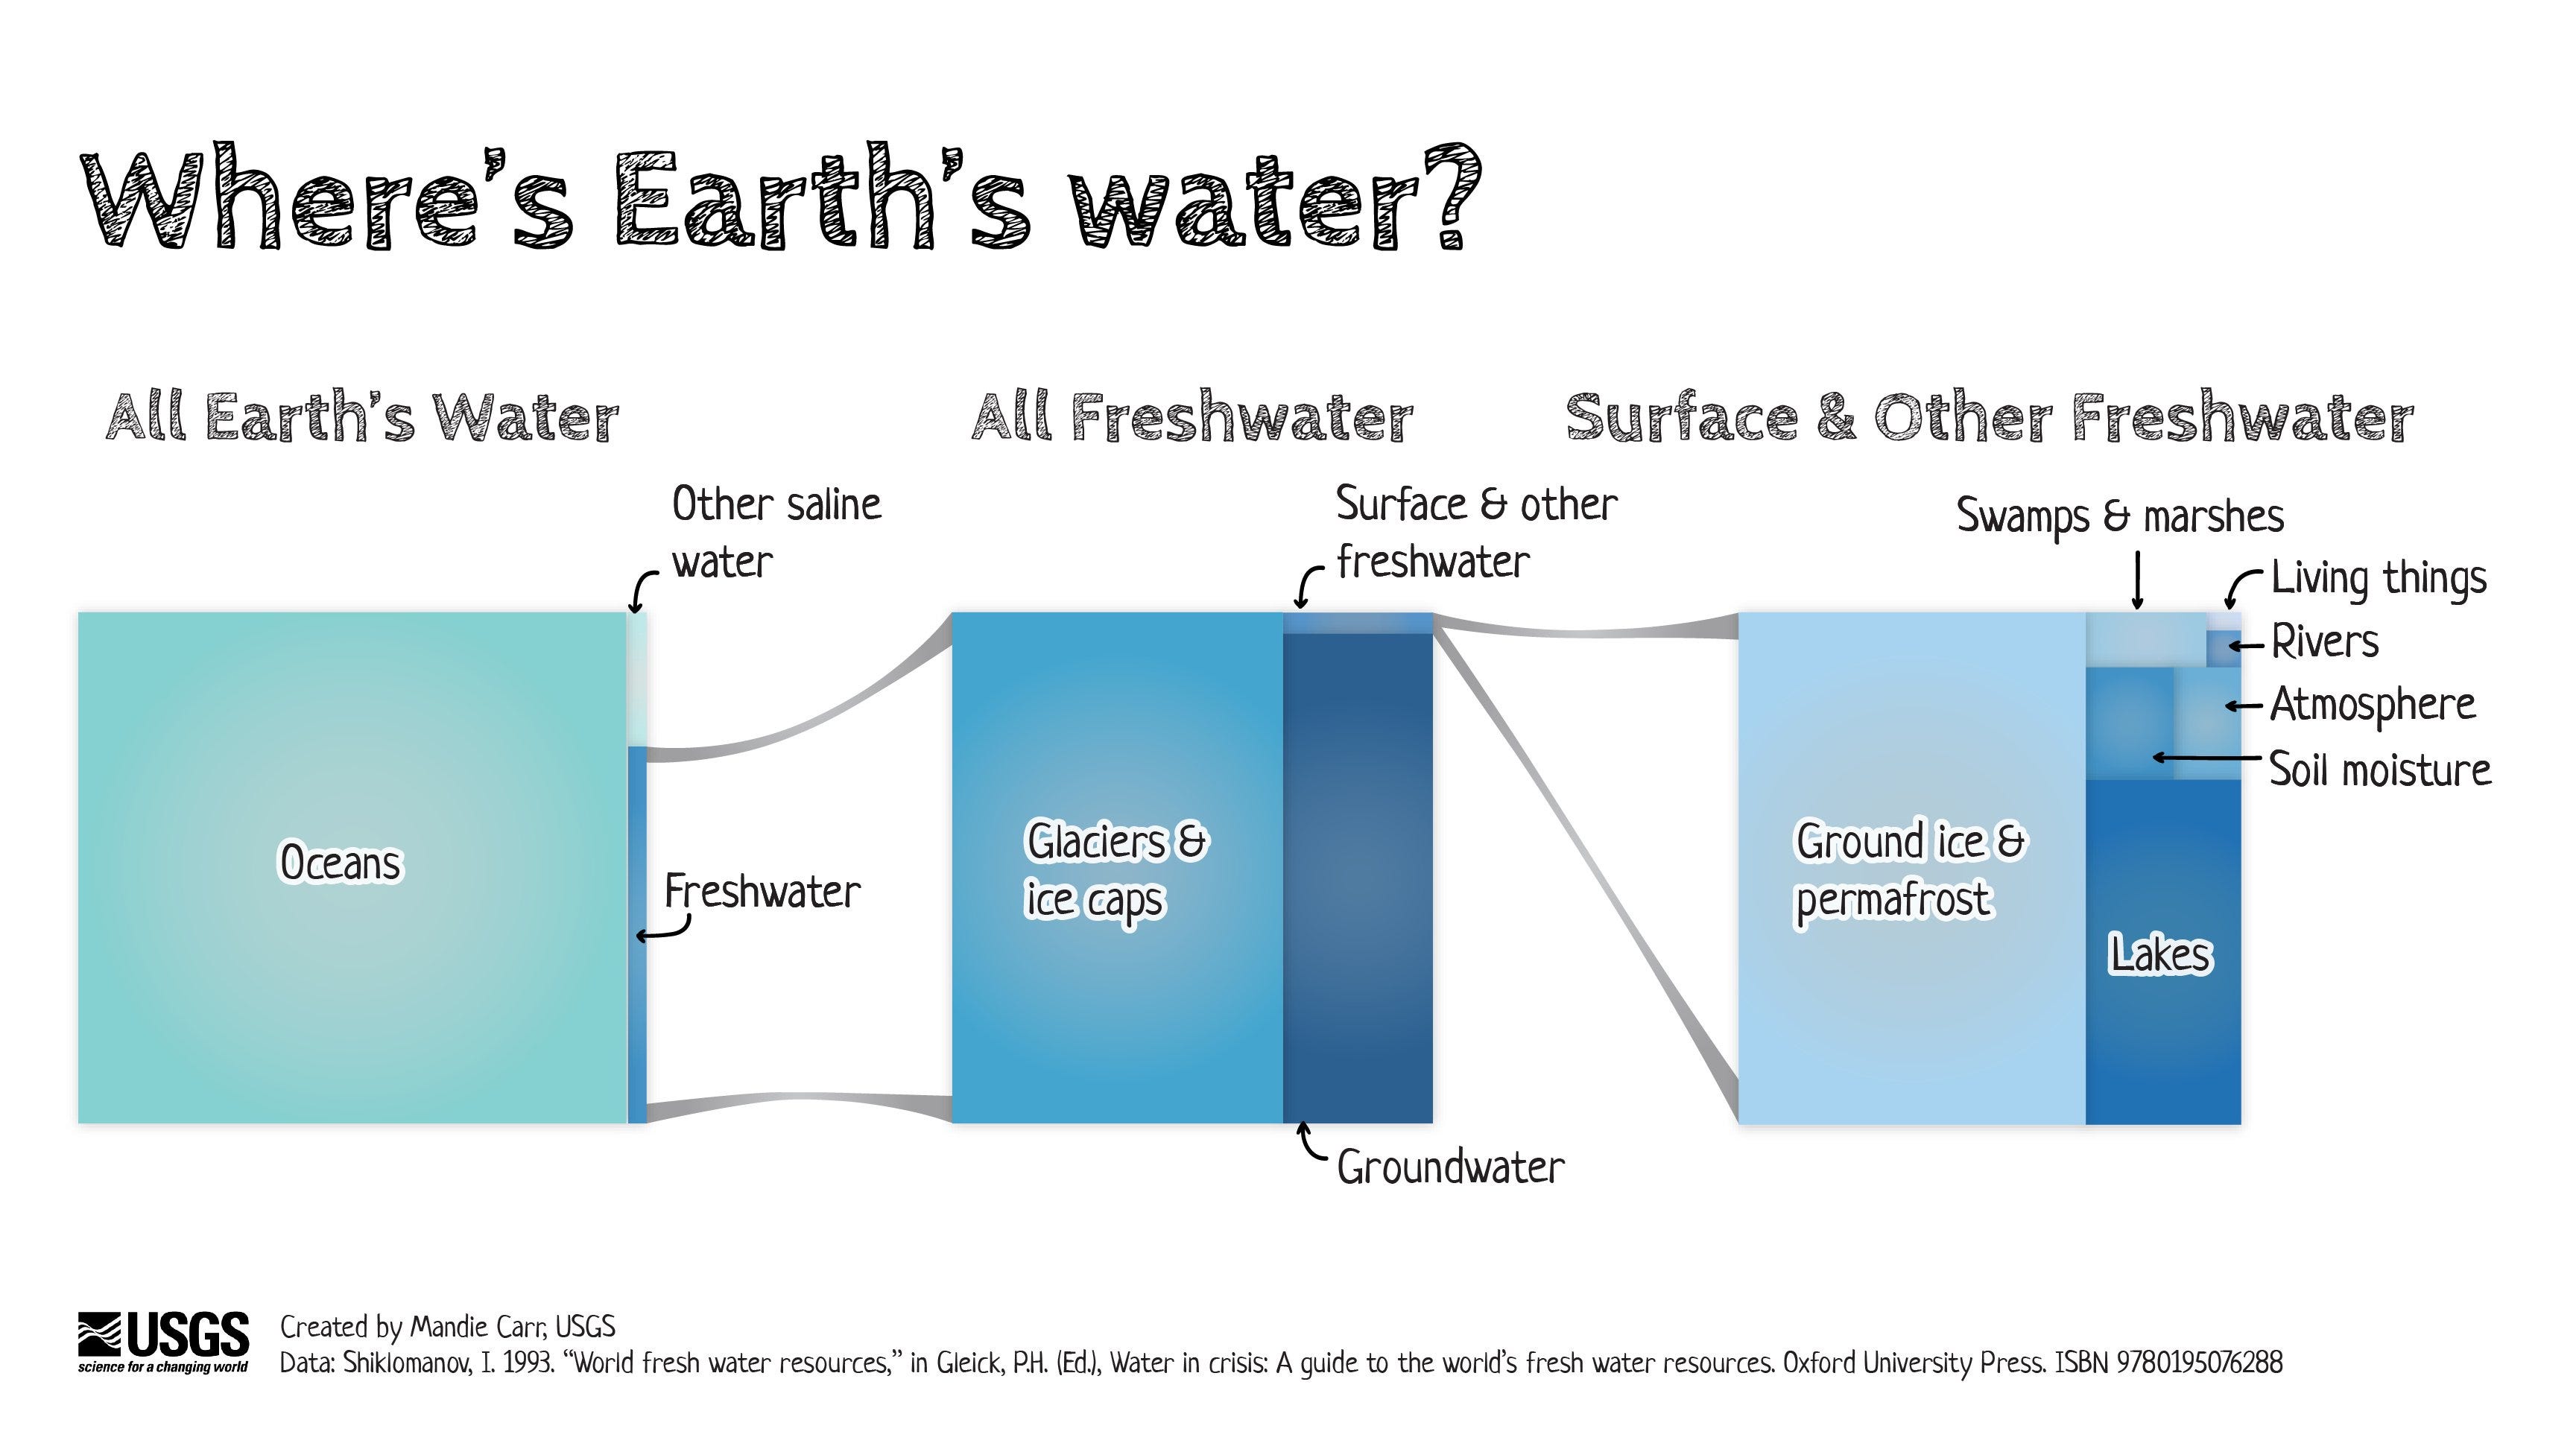
The two U.S. Geological Survey graphics below explain where Earth’s water resides. Freshwater only accounts for 2.5% of the water on Earth, and about two-thirds of that is locked up in glaciers and ice caps—at least for now!—while about 30% is groundwater. Surface freshwater is also dominated by ground ice and permafrost—yet another reminder of the significance of the cryosphere.

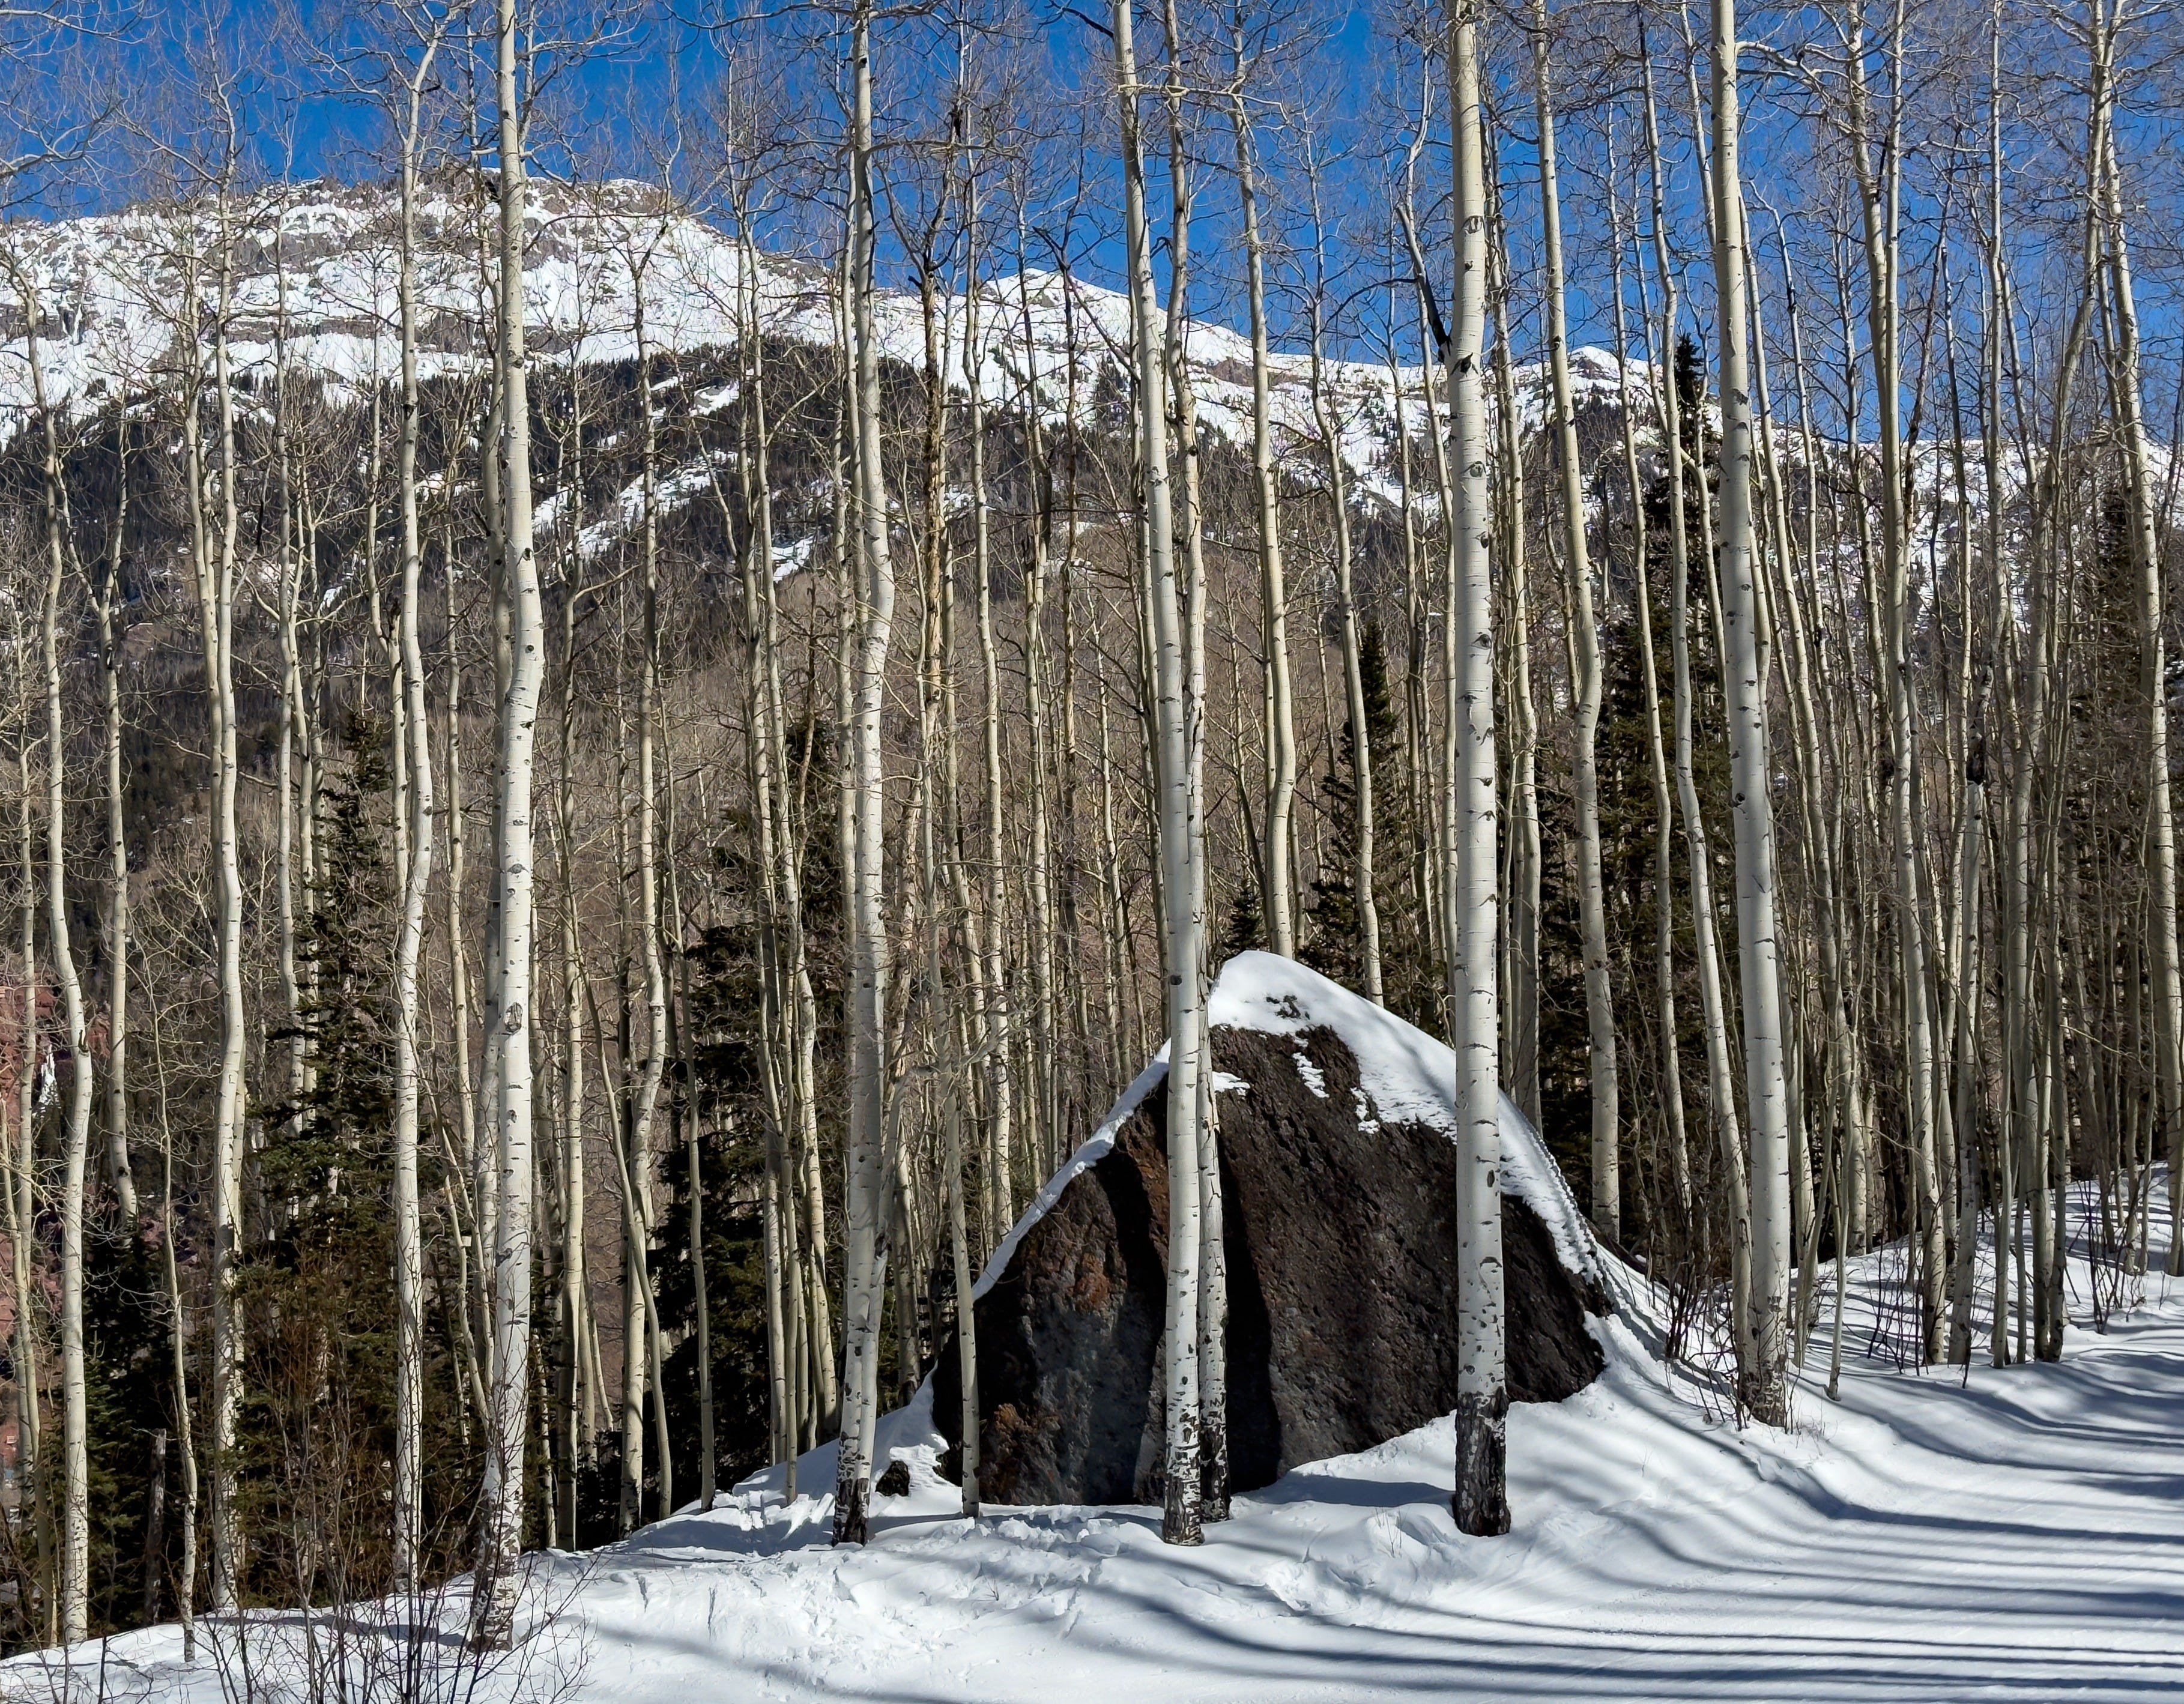
Final frames: Telluride photos
I had fun introducing friends to skiing at Telluride on a recent trip. The conditions weren’t ideal, but at least the snow was a little better than at Purgatory, my home mountain.


On the way down to town via the zigzagging Telluride Trail, you pass by an enormous boulder that looks like it couldn’t have gotten there by gravity alone. I’m no geologist, but I can’t help but think it’s a glacial erratic that was pushed to its present position by the force of frozen water in an Ice Age.