
Early-season snowpack update
Plus, SnowSlang: M is for "Milankovitch cycles"

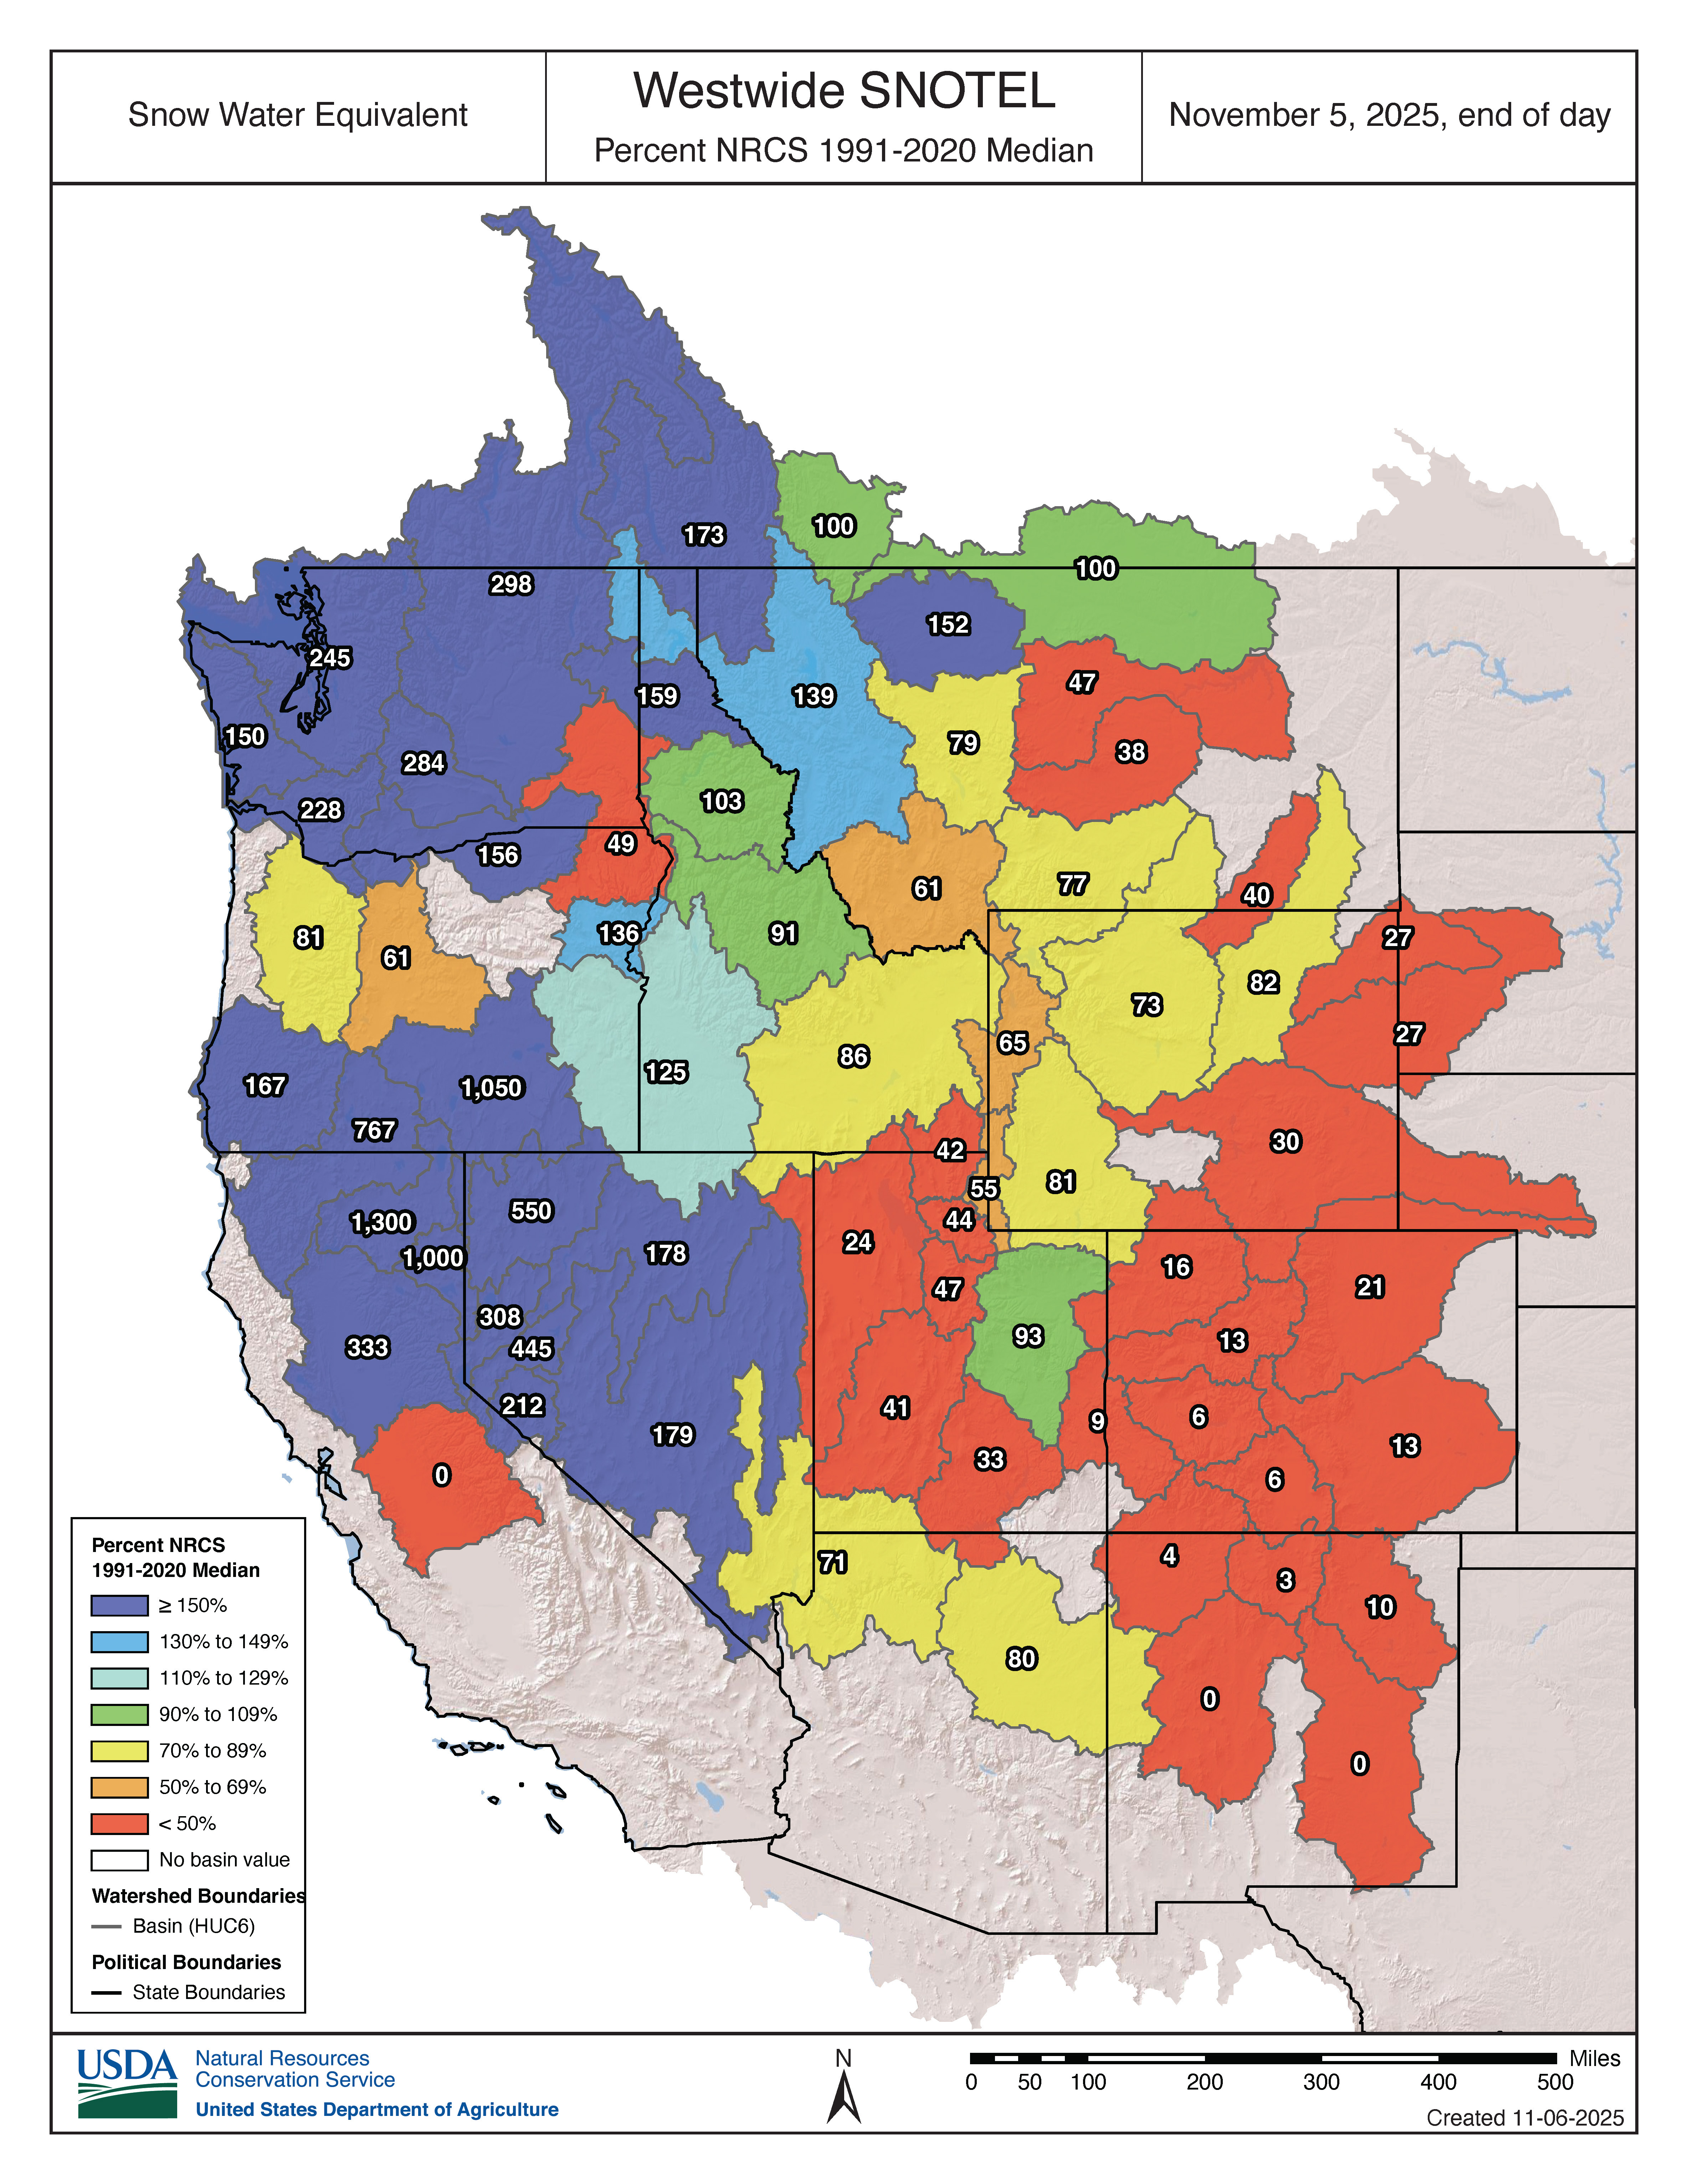
The West’s snowpack season is off to an uneven start.
As shown in the map above, parts of the region are way above normal for snow water equivalent, a measure of the snowpack’s water content. But here in Colorado, which supplies water to 19 other states and Mexico,1 the situation has been bleak so far.
It’s still very early in the season, so these numbers are subject to change quickly and dramatically. The Natural Resources Conservation Service, which provides the data, says its snowpack website isn’t being updated during the federal shutdown, and the basin maps “are being retired and will no longer be updated or available.” The maps are, in fact, still available, yet I wonder about their accuracy (e.g., the zero reading in California).
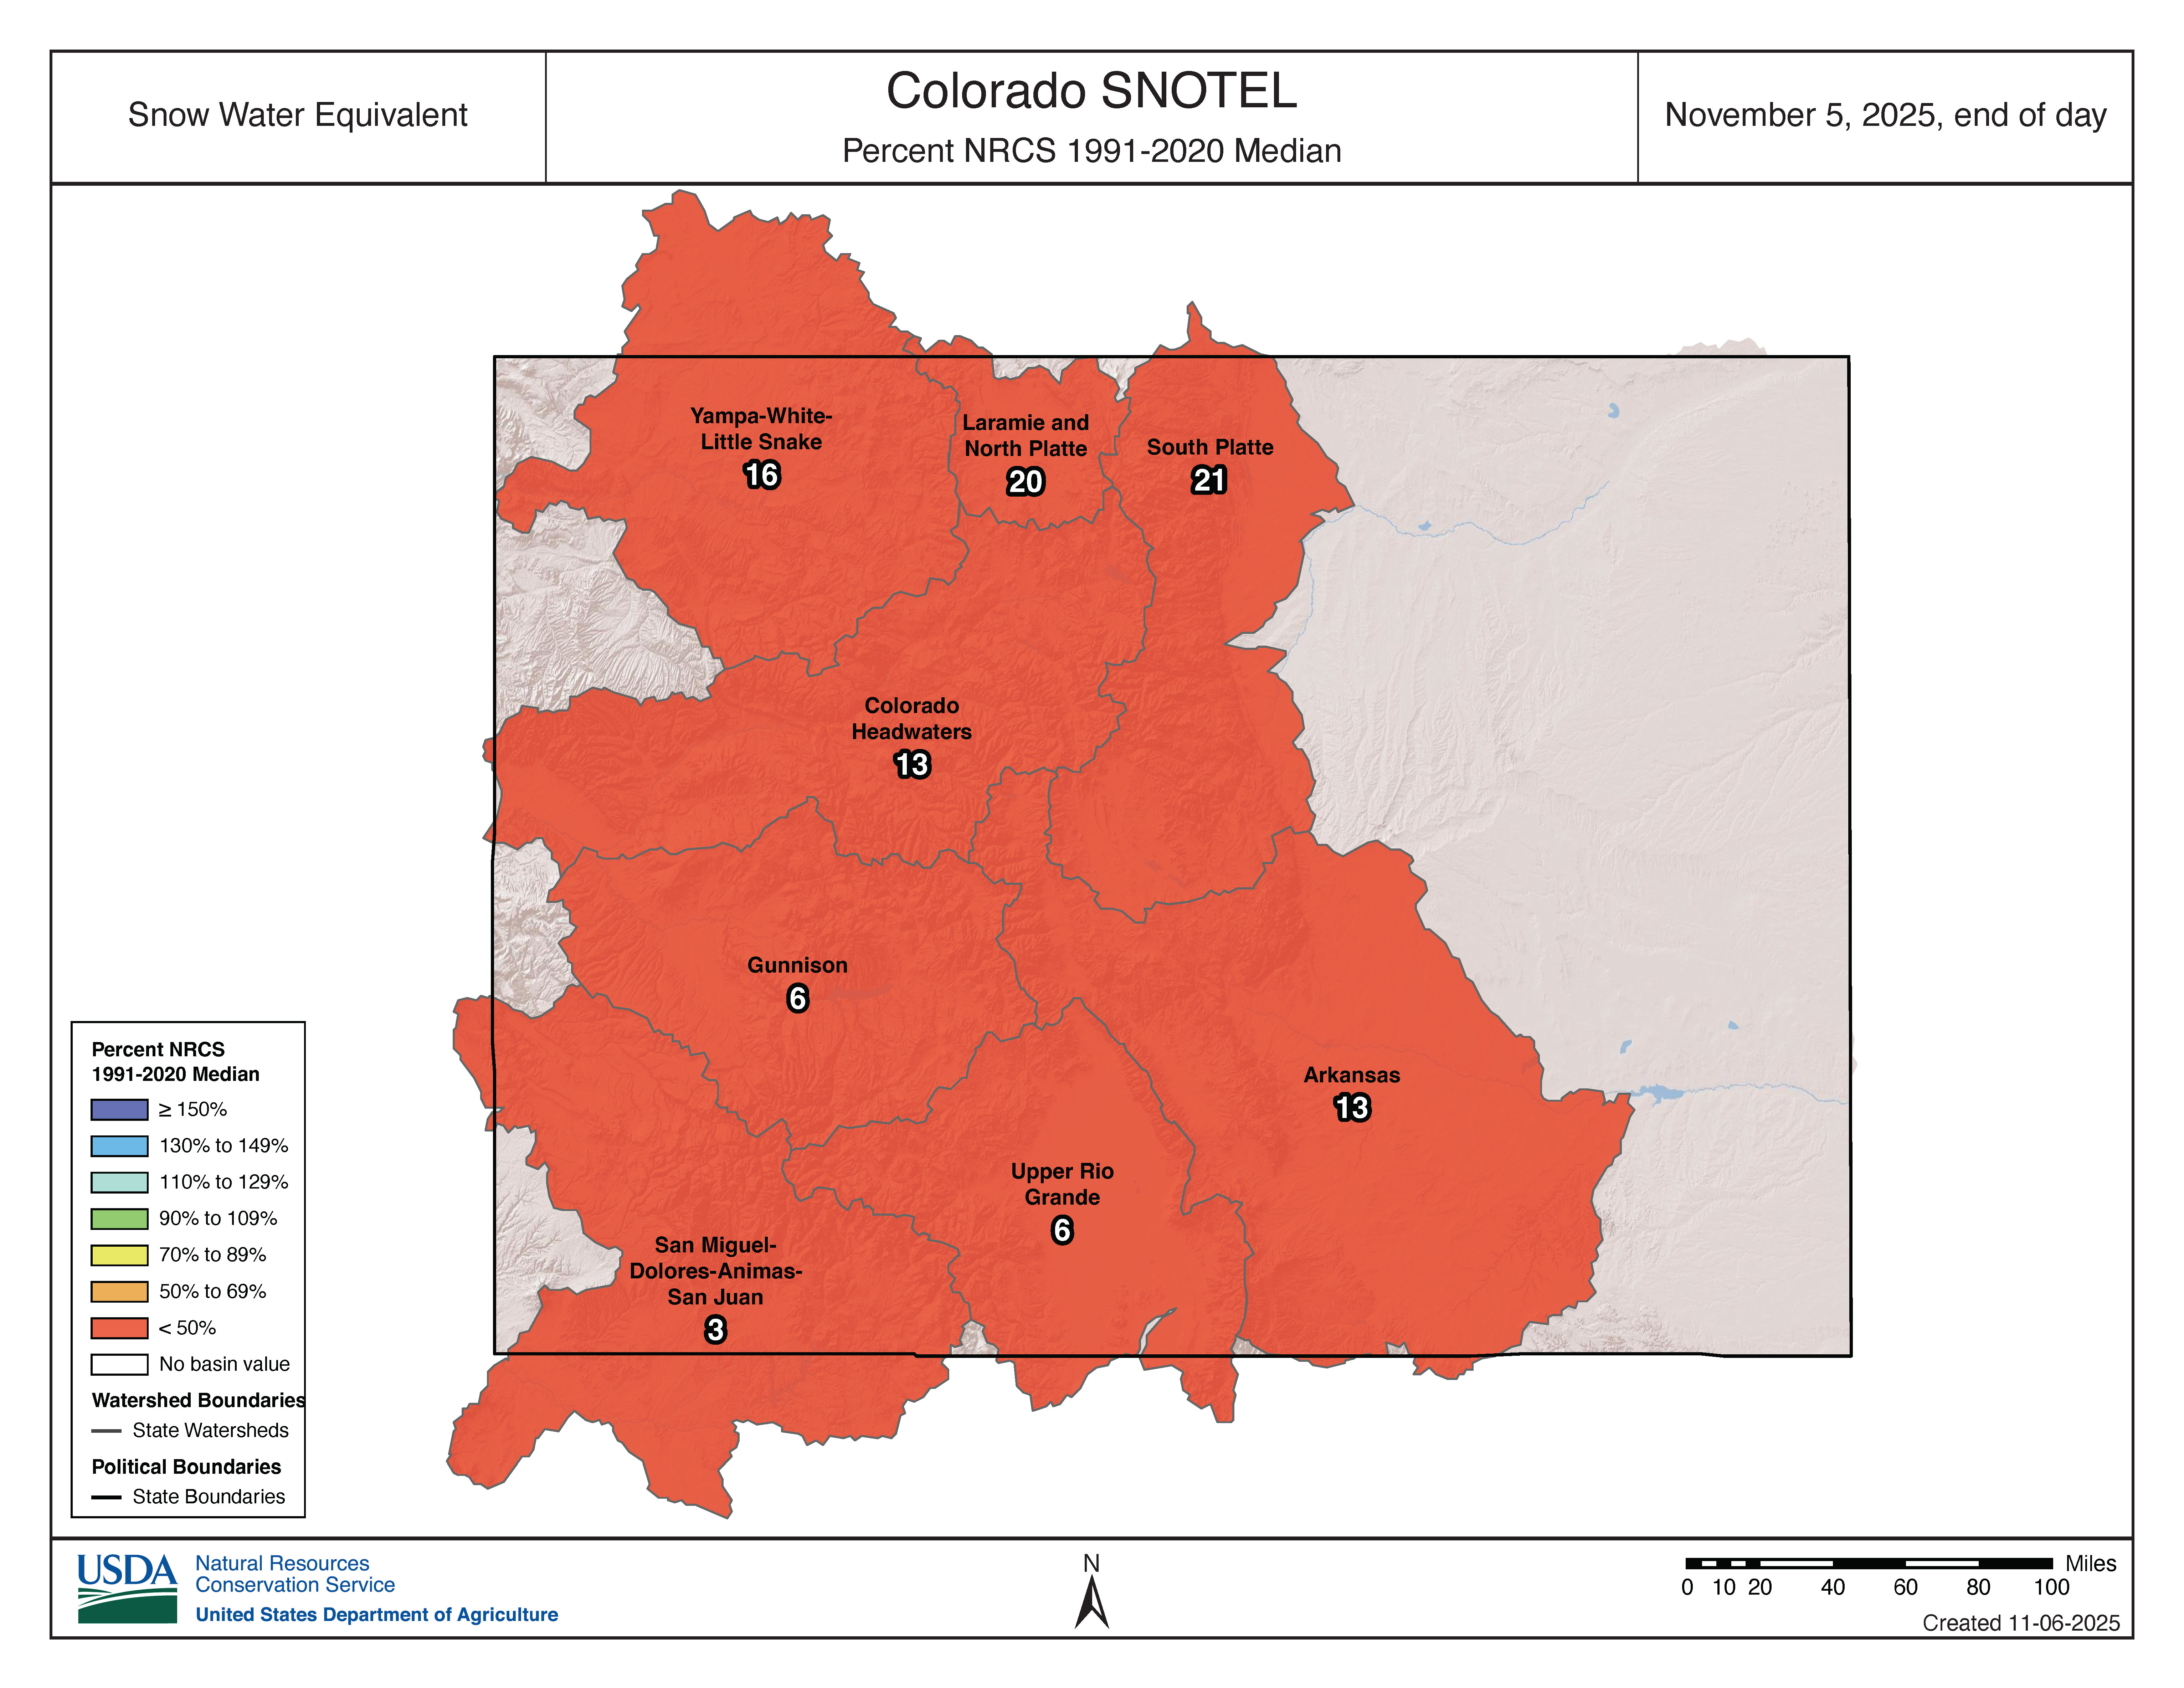
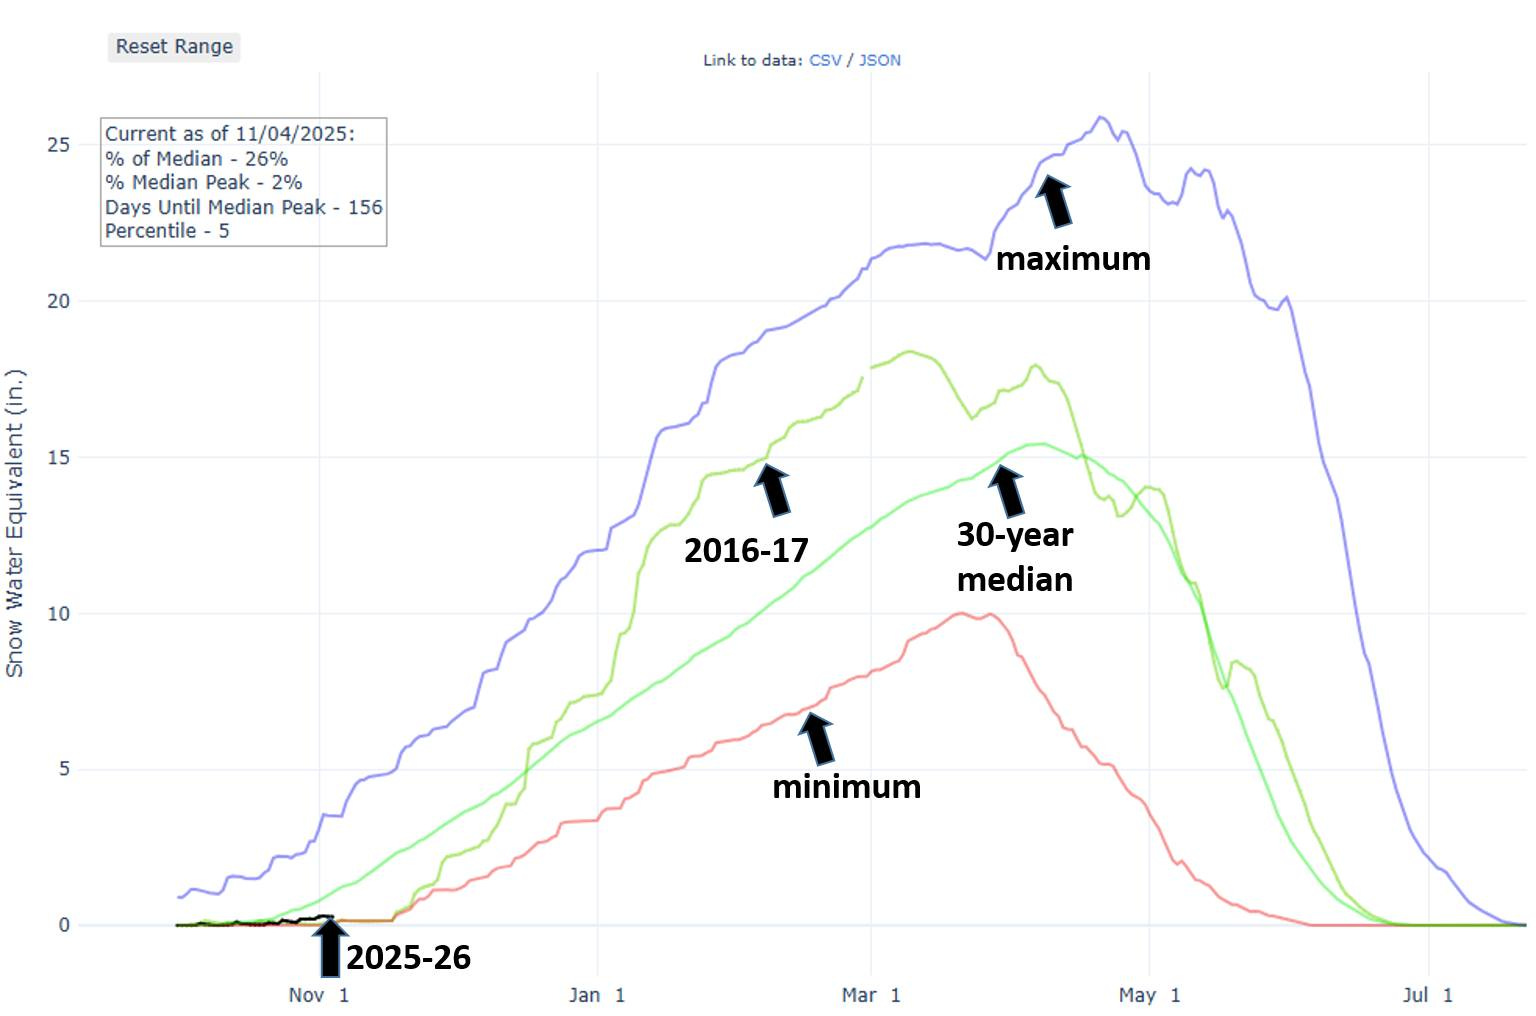
The Colorado Avalanche Information Center reported on Instagram that last month was the driest October for Colorado in terms of snow water equivalent since the 2016-2017 season. Below is a map showing the unfortunate situation on November 5, which has me seeing red. 😡
“Although it’s not great for Colorado’s water resources, a lack of early-season snow could be beneficial for future snowpack stability,” the CAIC wrote. “When we have snowy Octobers with big storms—followed by breaks in snowfall—that layer of snow sits on the ground, faceting and turning into weak, cohesionless snow that is unable to support future loads.”
Here’s another look at Colorado’s abysmal snowpack from CAIC’s Facebook page:
A few ski resorts in Colorado (Arapahoe Basin, Keystone, and Winter Park) have opened up extremely limited terrain thanks to snowmaking, but in many places, it has been too warm to make fake snow.
Very long-range forecasts for snowfall are notoriously unreliable, but for what it’s worth, the map below shows the Climate Prediction Center’s broad-brush outlook for precipitation for the November-December-January period.
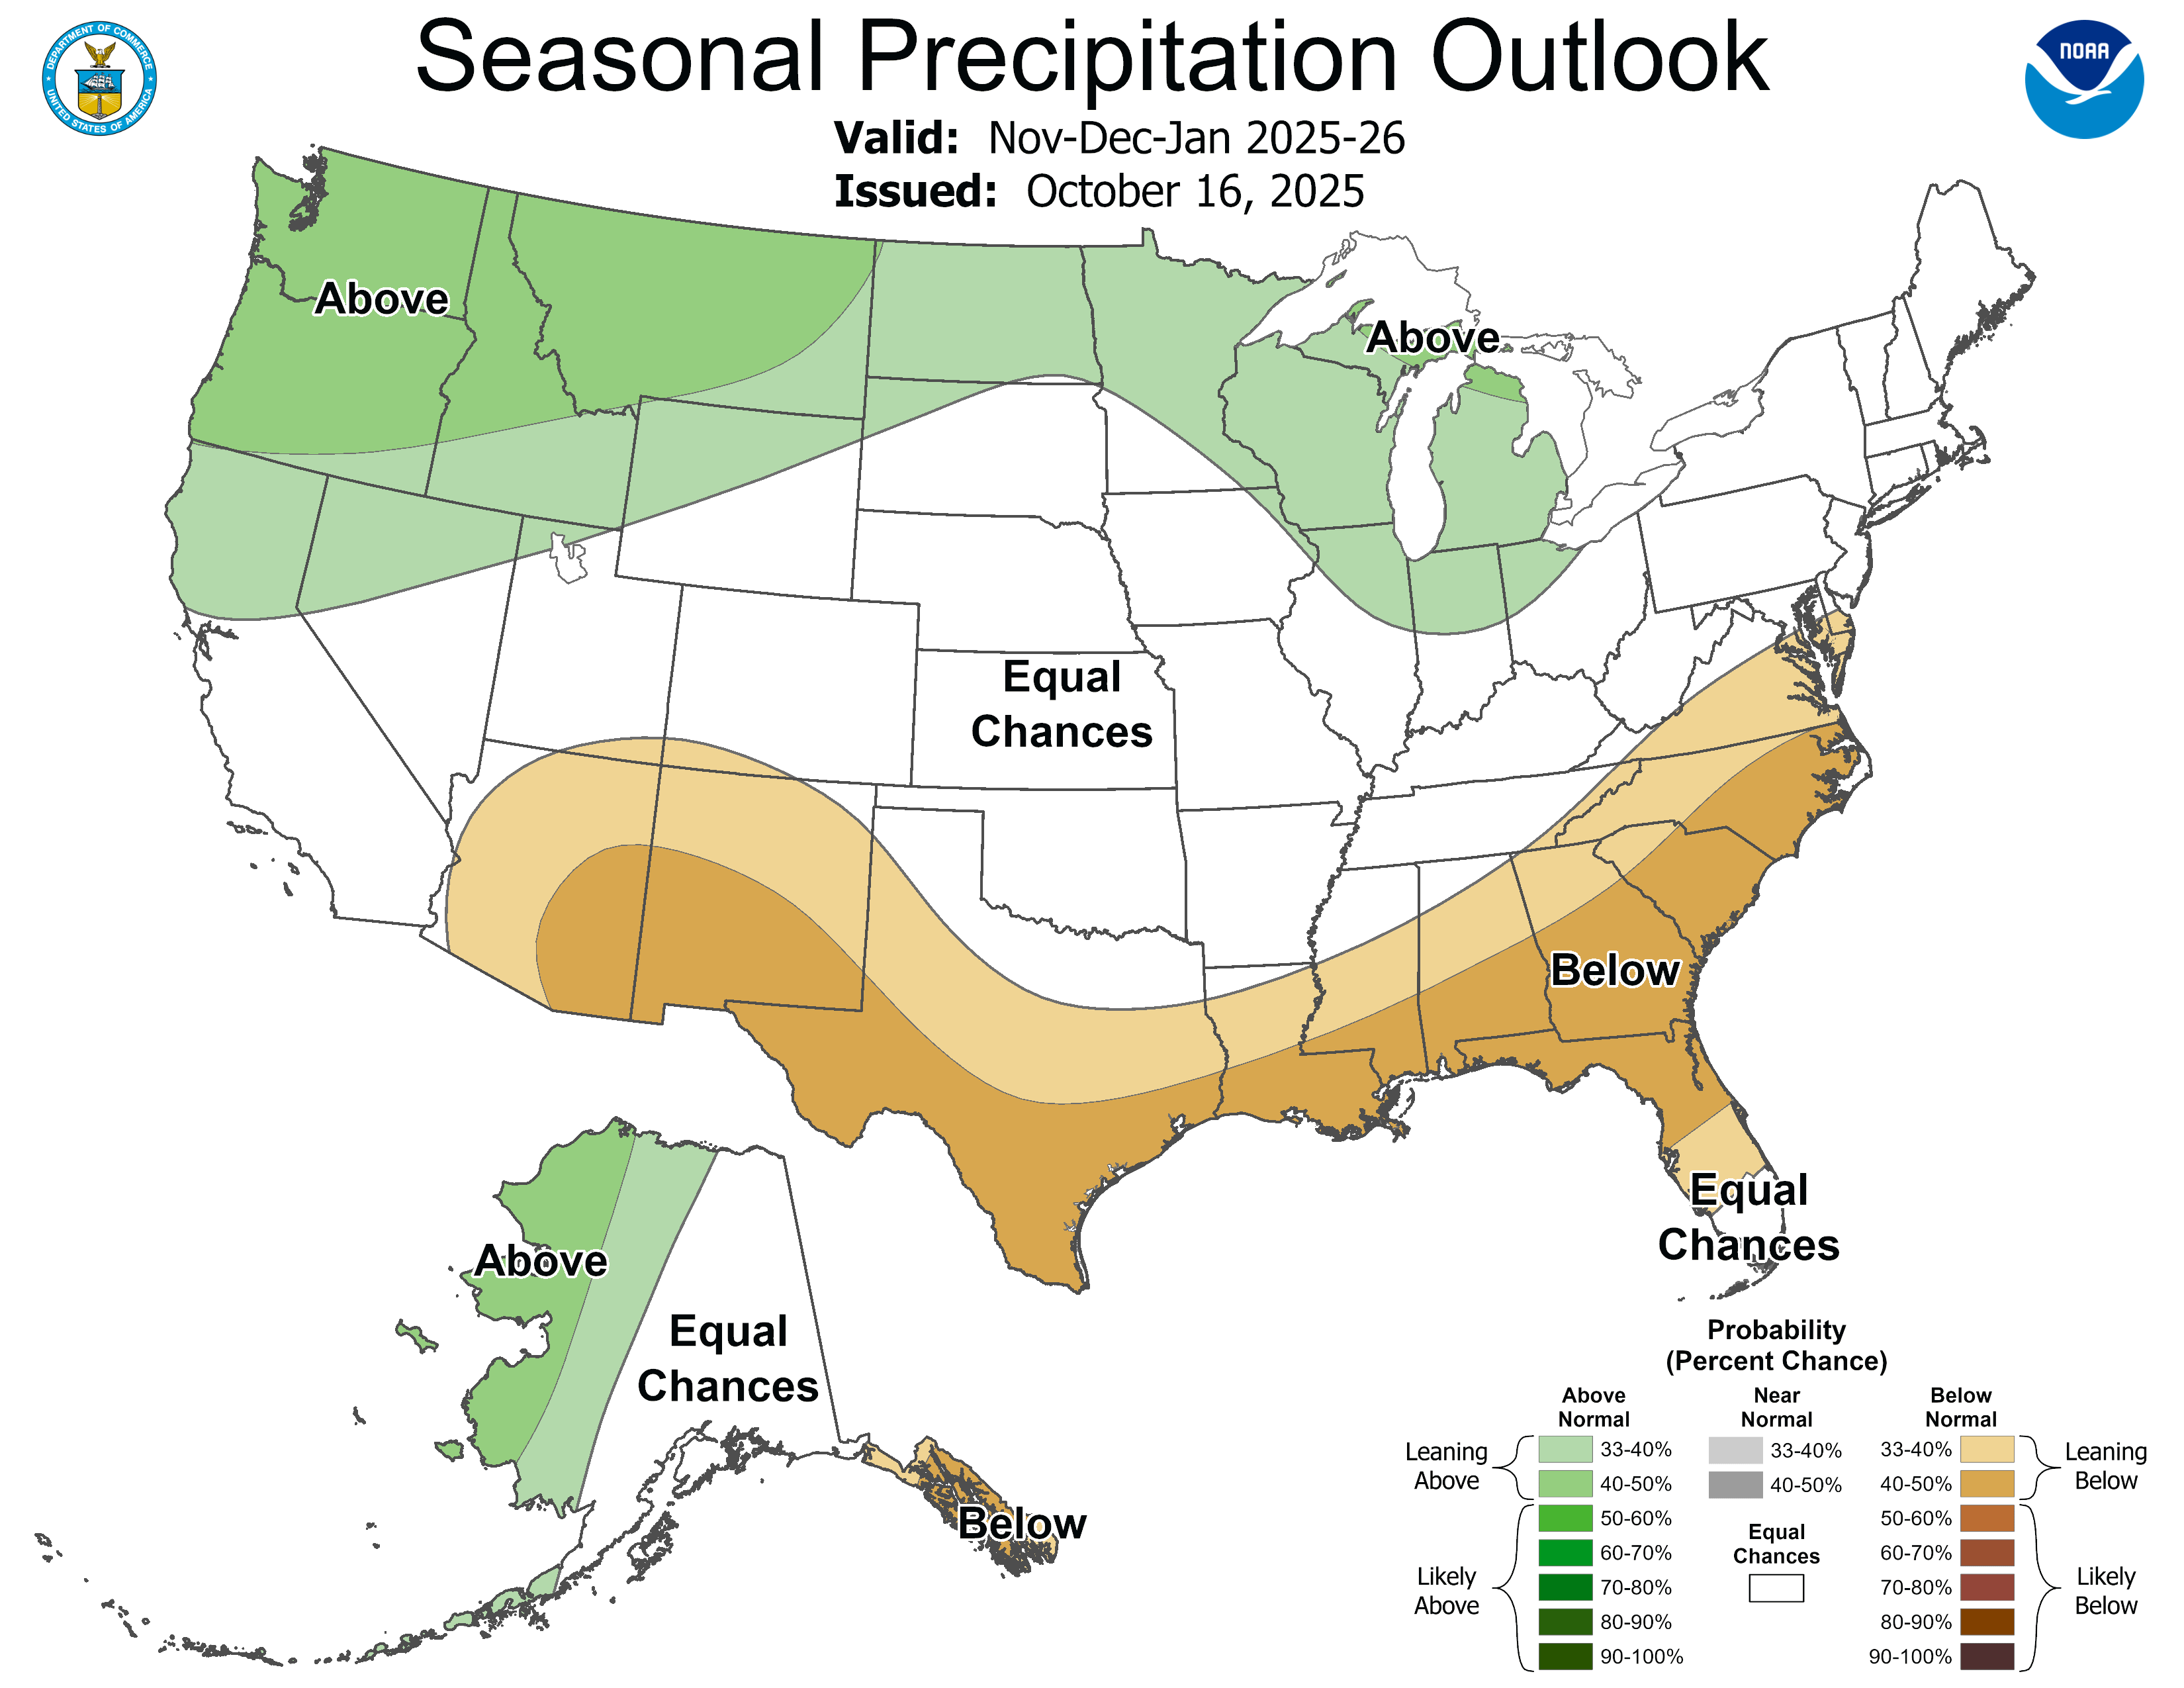
We’re currently in a La Niña pattern, which tends to make northern-tier states wetter and the Southwest drier in winter, although federal forecasters don’t expect La Niña to last very long.
SnowSlang: M is for “Milankovitch cycles”
For eons, our planet’s climate has been oscillating between extremes.
In “hothouse” or “greenhouse” periods, temperatures soared, snow and ice were scarce, and the oceans rose high enough to drown portions of the continents.
In “icehouse” periods, temperatures plunged and ice sheets expanded from the poles, locking up enough water to lower sea levels by hundreds of feet.
What’s behind these long-term shifts? On geological timescales of hundreds of millions of years, there are numerous causes, including plate tectonics, volcanic activity, and natural fluctuations in atmospheric levels of carbon dioxide.
But on shorter time scales—tens of thousands to hundreds of thousands of years—there’s another key factor in our ever-changing climate: the motion of the Earth itself.
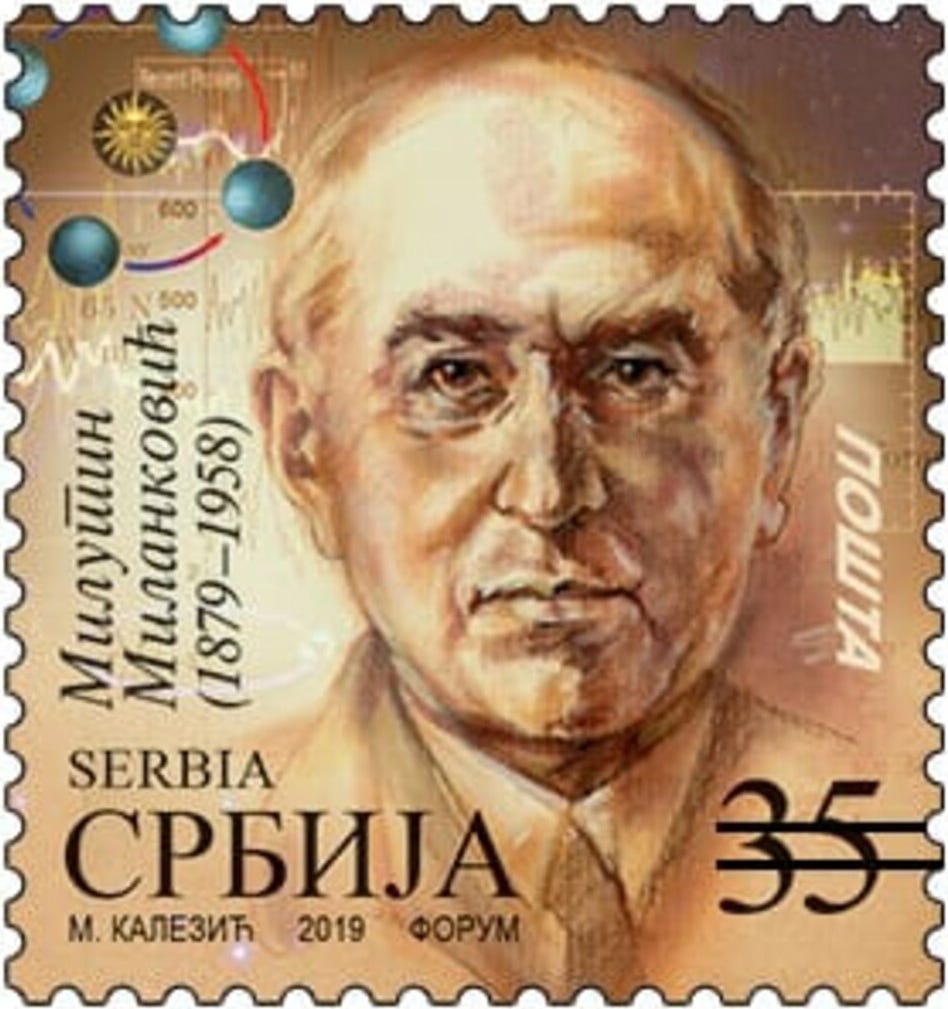
In the early 20th century, Serbian mathematician Milutin Milankovitch calculated how three repeating patterns alter the amount of solar radiation reaching the Earth, thereby influencing the climate in somewhat predictable ways. Known as the Milankovitch cycles, these three drivers interact with one another and have led our planet to toggle between glacial and interglacial periods for millions of years during our current icehouse phase:
Eccentricity (~100,000-year cycle): Our orbit shifts from a nearly perfect circle to slightly more elliptical, which alters Earth’s distance to the sun and changes how sunlight is distributed between seasons and hemispheres. Eccentricity doesn’t make a big difference in the total sunlight that Earth receives, but its interaction with precession (described below) helps alter the climate.
Obliquity (~41,000 years): The tilt of Earth’s axis varies between about 22.1 and 24.5 degrees (we’re currently at 23.4 degrees). More tilt means more extreme seasons—hotter summers and colder winters—especially at high latitudes. Less tilt means more moderate seasonal differences.
Precession (~19,000–23,000 years): Like a spinning top, the planet wobbles on its axis, which alters when seasons occur relative to Earth’s orbital position. If, for example, the Northern Hemisphere’s summer occurs during the closest passage to the sun (perihelion), the hotter summers melt more snow/ice.
The NASA animation below illustrates how each of these cycles unfolds.
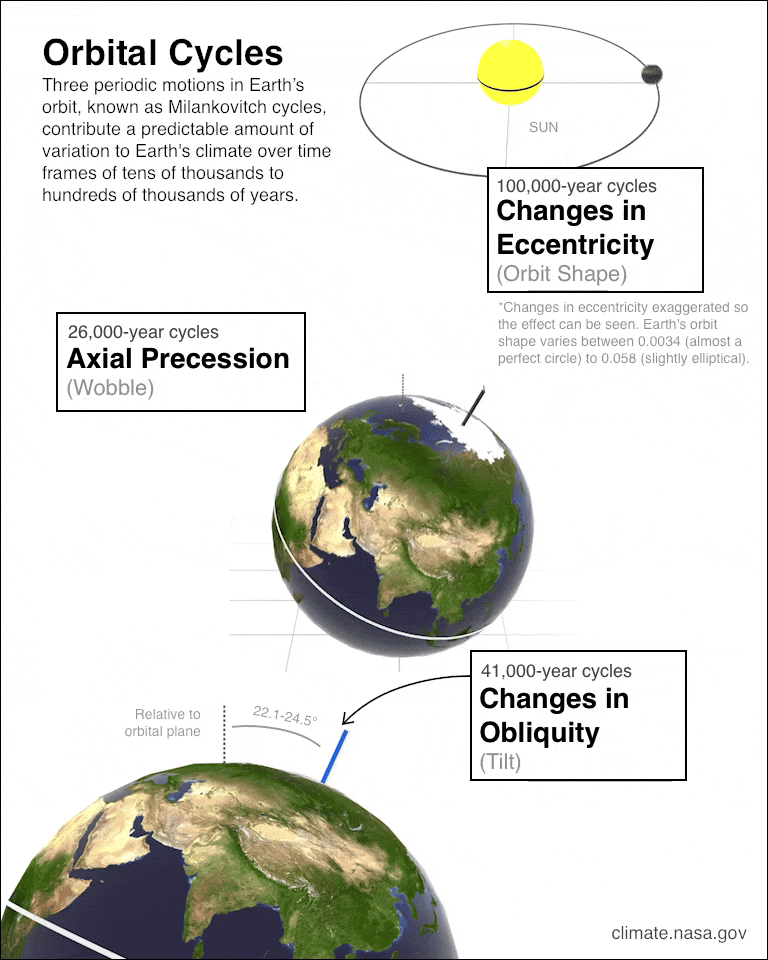
Over time, these changes in eccentricity, obliquity, and precession work in tandem to shape the climate, especially at high latitudes in the Northern Hemisphere. These regular cycles in Earth’s motion play a leading role in how much snow and ice persist from year to year. If summers are cool enough, winter snow doesn’t melt, ice sheets expand, and the increasing reflectivity (albedo) of the Earth’s surface causes further cooling in a feedback loop.
Some climate change skeptics have pointed to the Milankovitch cycles as a potential cause of the global warming we’re experiencing. But the science shows otherwise. Our current warming is playing out over decades to centuries, not tens of thousands to hundreds of thousands of years.
More from NASA:
Over the last 150 years, Milankovitch cycles have not changed the amount of solar energy absorbed by Earth very much. In fact, NASA satellite observations show that over the last 40 years, solar radiation has actually decreased somewhat . . .
. . . If Earth’s current warming was due to the Sun, scientists say we should expect temperatures in both the lower atmosphere (troposphere) and the next layer of the atmosphere, the stratosphere, to warm. Instead, observations from balloons and satellites show Earth’s surface and lower atmosphere have warmed but the stratosphere has cooled.
Complete the snow.news reader survey
Thanks to everyone who has taken a few moments to complete the quick, anonymous survey I’ve created to gather feedback on this newsletter!
The responses were informative, and it’s always great to hear suggestions for how I can improve.
The survey is still live, so please let me know what you think about the newsletter.
This factoid is from the Colorado Water Conservation Board, but the Colorado Water Center at Colorado State University says the figure is 18 states plus Mexico.