

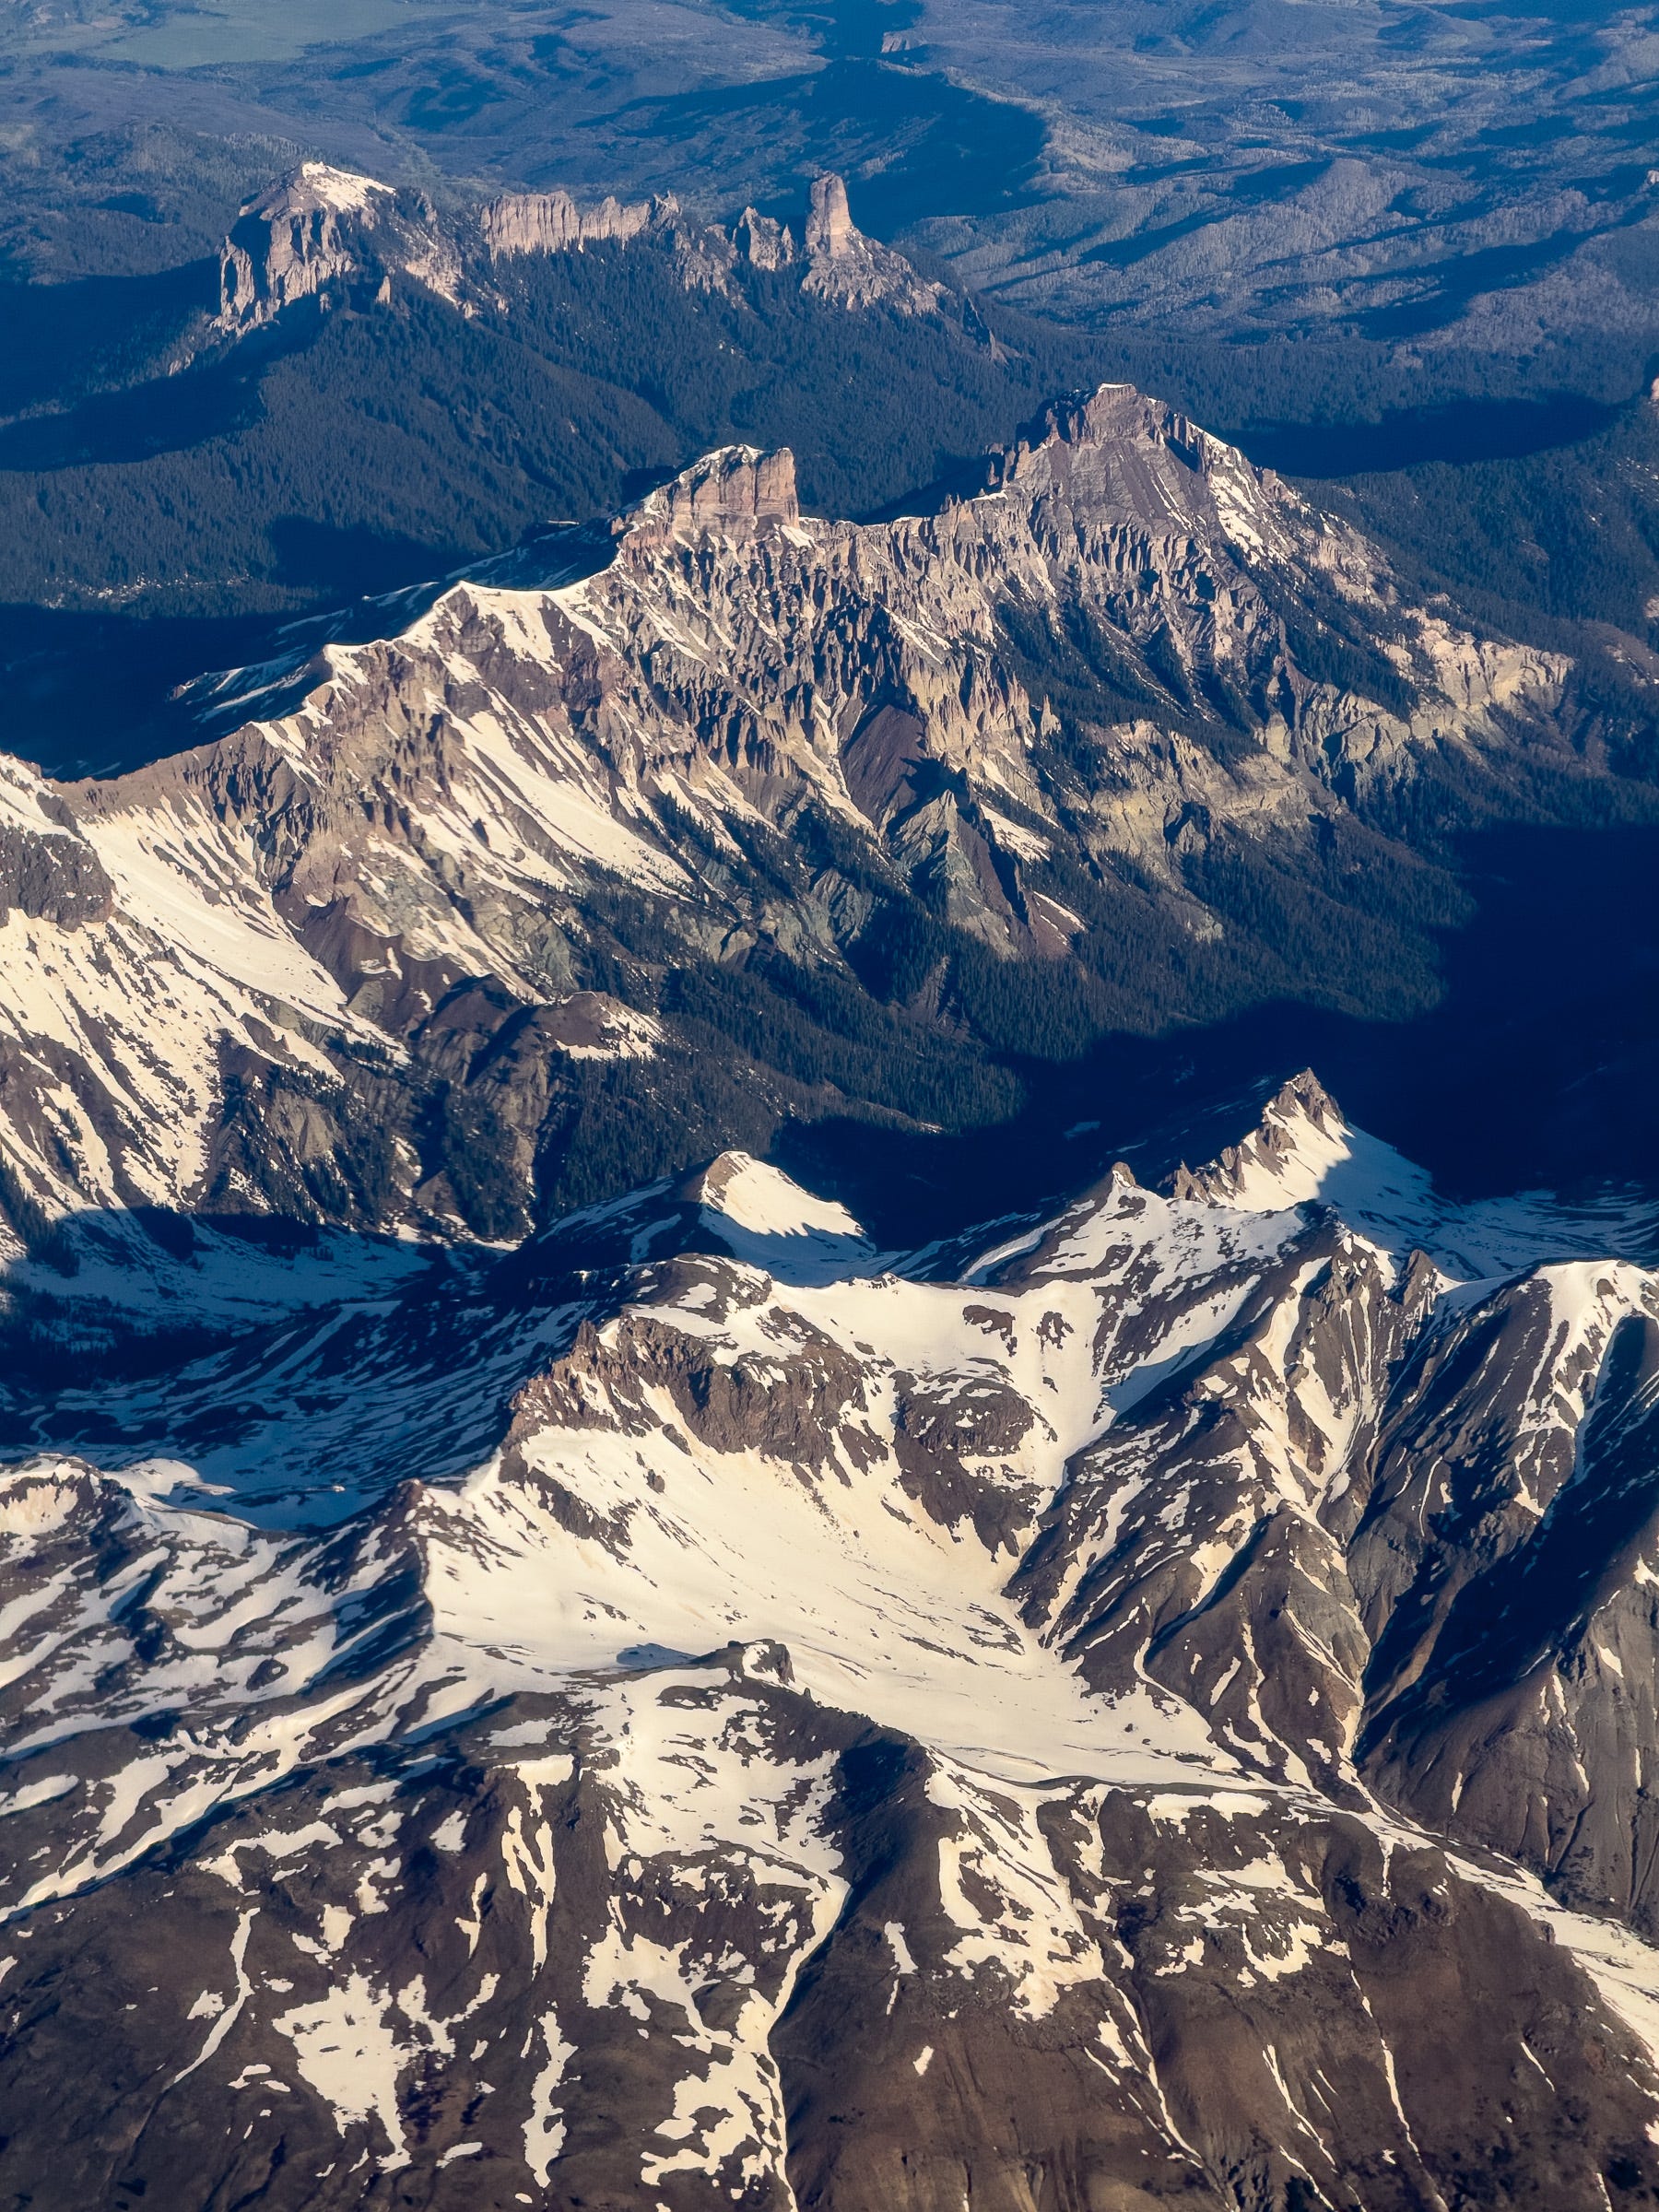
Not to sound like a broken record, but this snow drought really has been record-breaking.
As a skeptical journalist who is semi-allergic to hyperbole, I’m wary of slipping into the “Worst. Season. Ever.” narrative that may drive clicks but warp reality.
But two recent updates from scientists drive home just how abysmal the West’s 2025-2026 snow season has been, with the snowpack hitting new lows in some datasets.
Cue the levity from The Simpsons’ Comic Book Guy:
Rapid assessment of “extreme” snow drought
The first report, from the Western Water Assessment at the University of Colorado Boulder, is a “rapid assessment” of the “extreme snow drought” in Colorado, Utah, and Wyoming.
I’ll let the report speak for itself. Here are the first four of its key findings (SWE is snow water equivalent—the snowpack’s water content—and UCRB is the Upper Colorado River Basin):
“The 2026 water year was the worst winter on record for snow accumulation with record low (since 1980) April 1 SWE in Colorado (22% of average), Utah (19% of average), Wyoming (50% of average) and UCRB (23% of average).
Record warm October-March temperatures caused frequent rain events below 8,000 feet and record warm March temperatures caused snowpack to peak one month early and rapidly melt.
Statewide water year precipitation was below average in Colorado (74% of median) and Utah (88%) but near average in Wyoming (96%).
Manual snow collection data available since 1931 reveals 2026 as the year of lowest April 1 SWE but 1934 and 1977 also experienced significant snow drought.”
The report emphasizes this winter’s stunning warmth and concludes that “since the 1980s, the 2026 winter was the worst on record by a wide margin in Colorado, Utah and the UCRB.”
“The 2026 water year was likely one of the first years when parts of the Intermountain West experienced a purely warm snow drought,” the report says. “Warm snow drought is defined as below average snowpack that is predominantly caused by warm temperatures rather than only low precipitation.”
The images below show SWE on April 1, the milestone date often used to gauge the West’s snowpack near its seasonal peak. The map on the left illustrates the vast geographic extent of the snow drought. The zoomed-in map on the right uses red dots to identify the striking number of monitoring stations that recorded their lowest April 1 SWE.
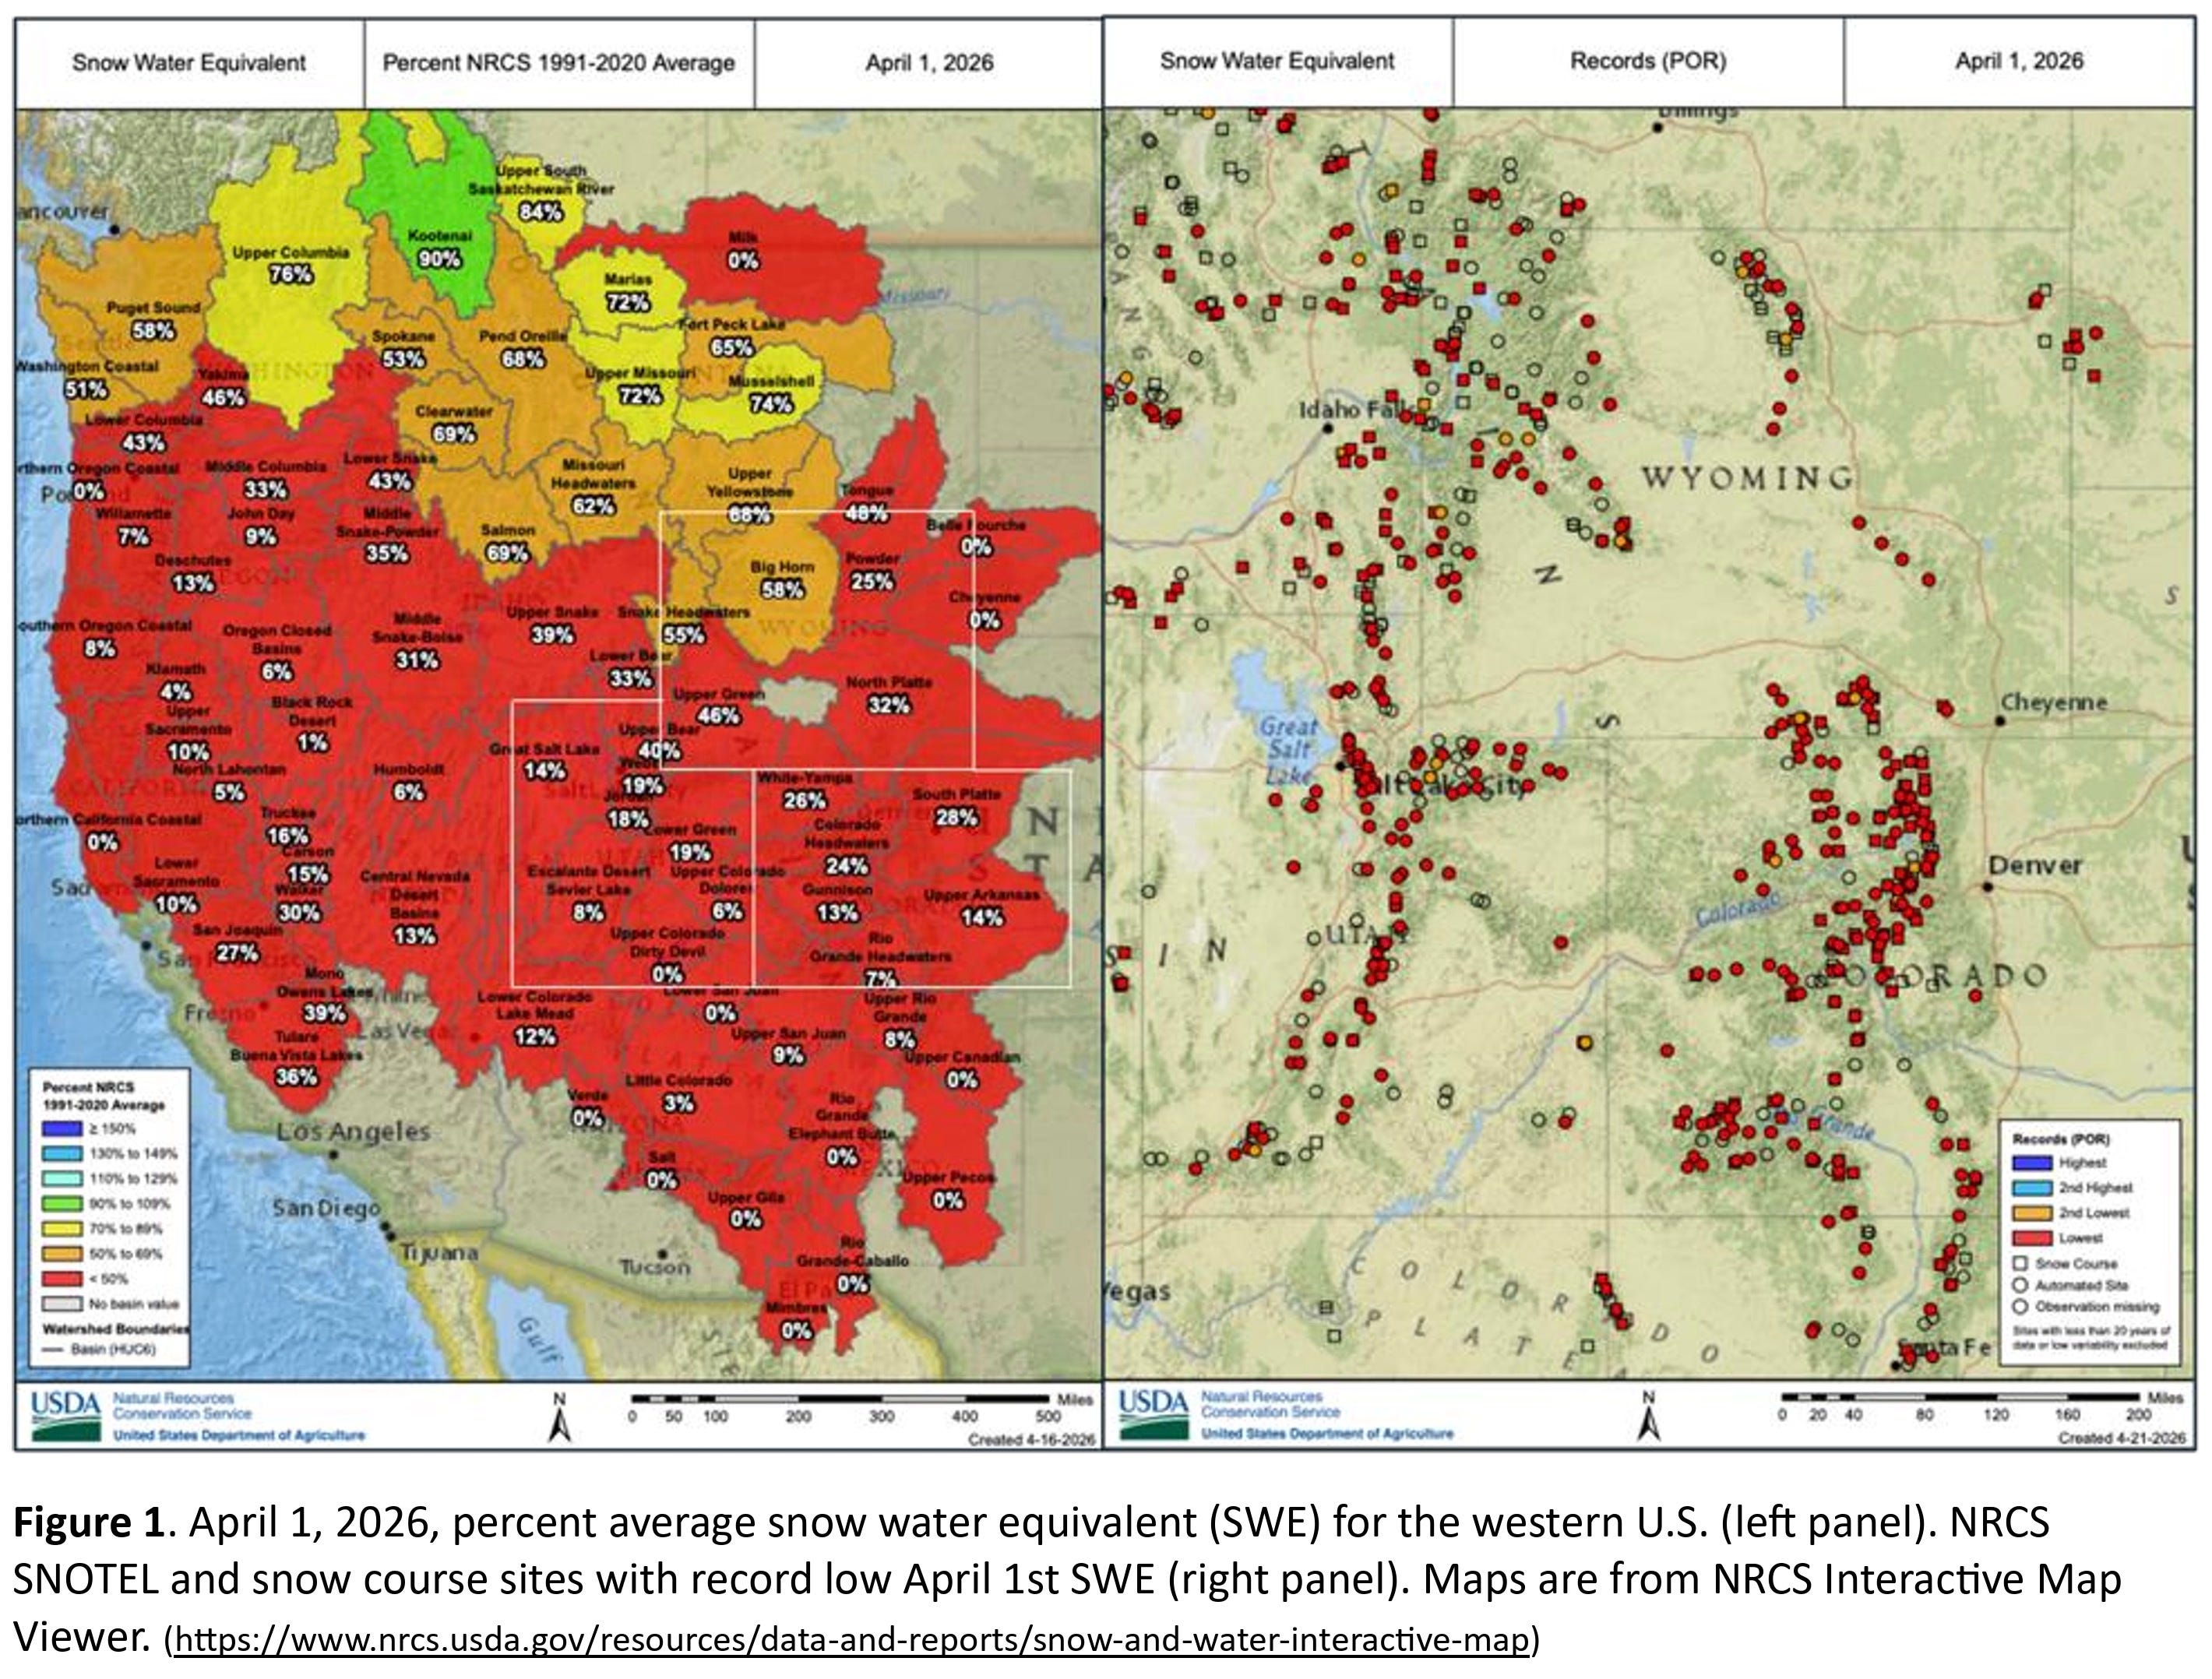
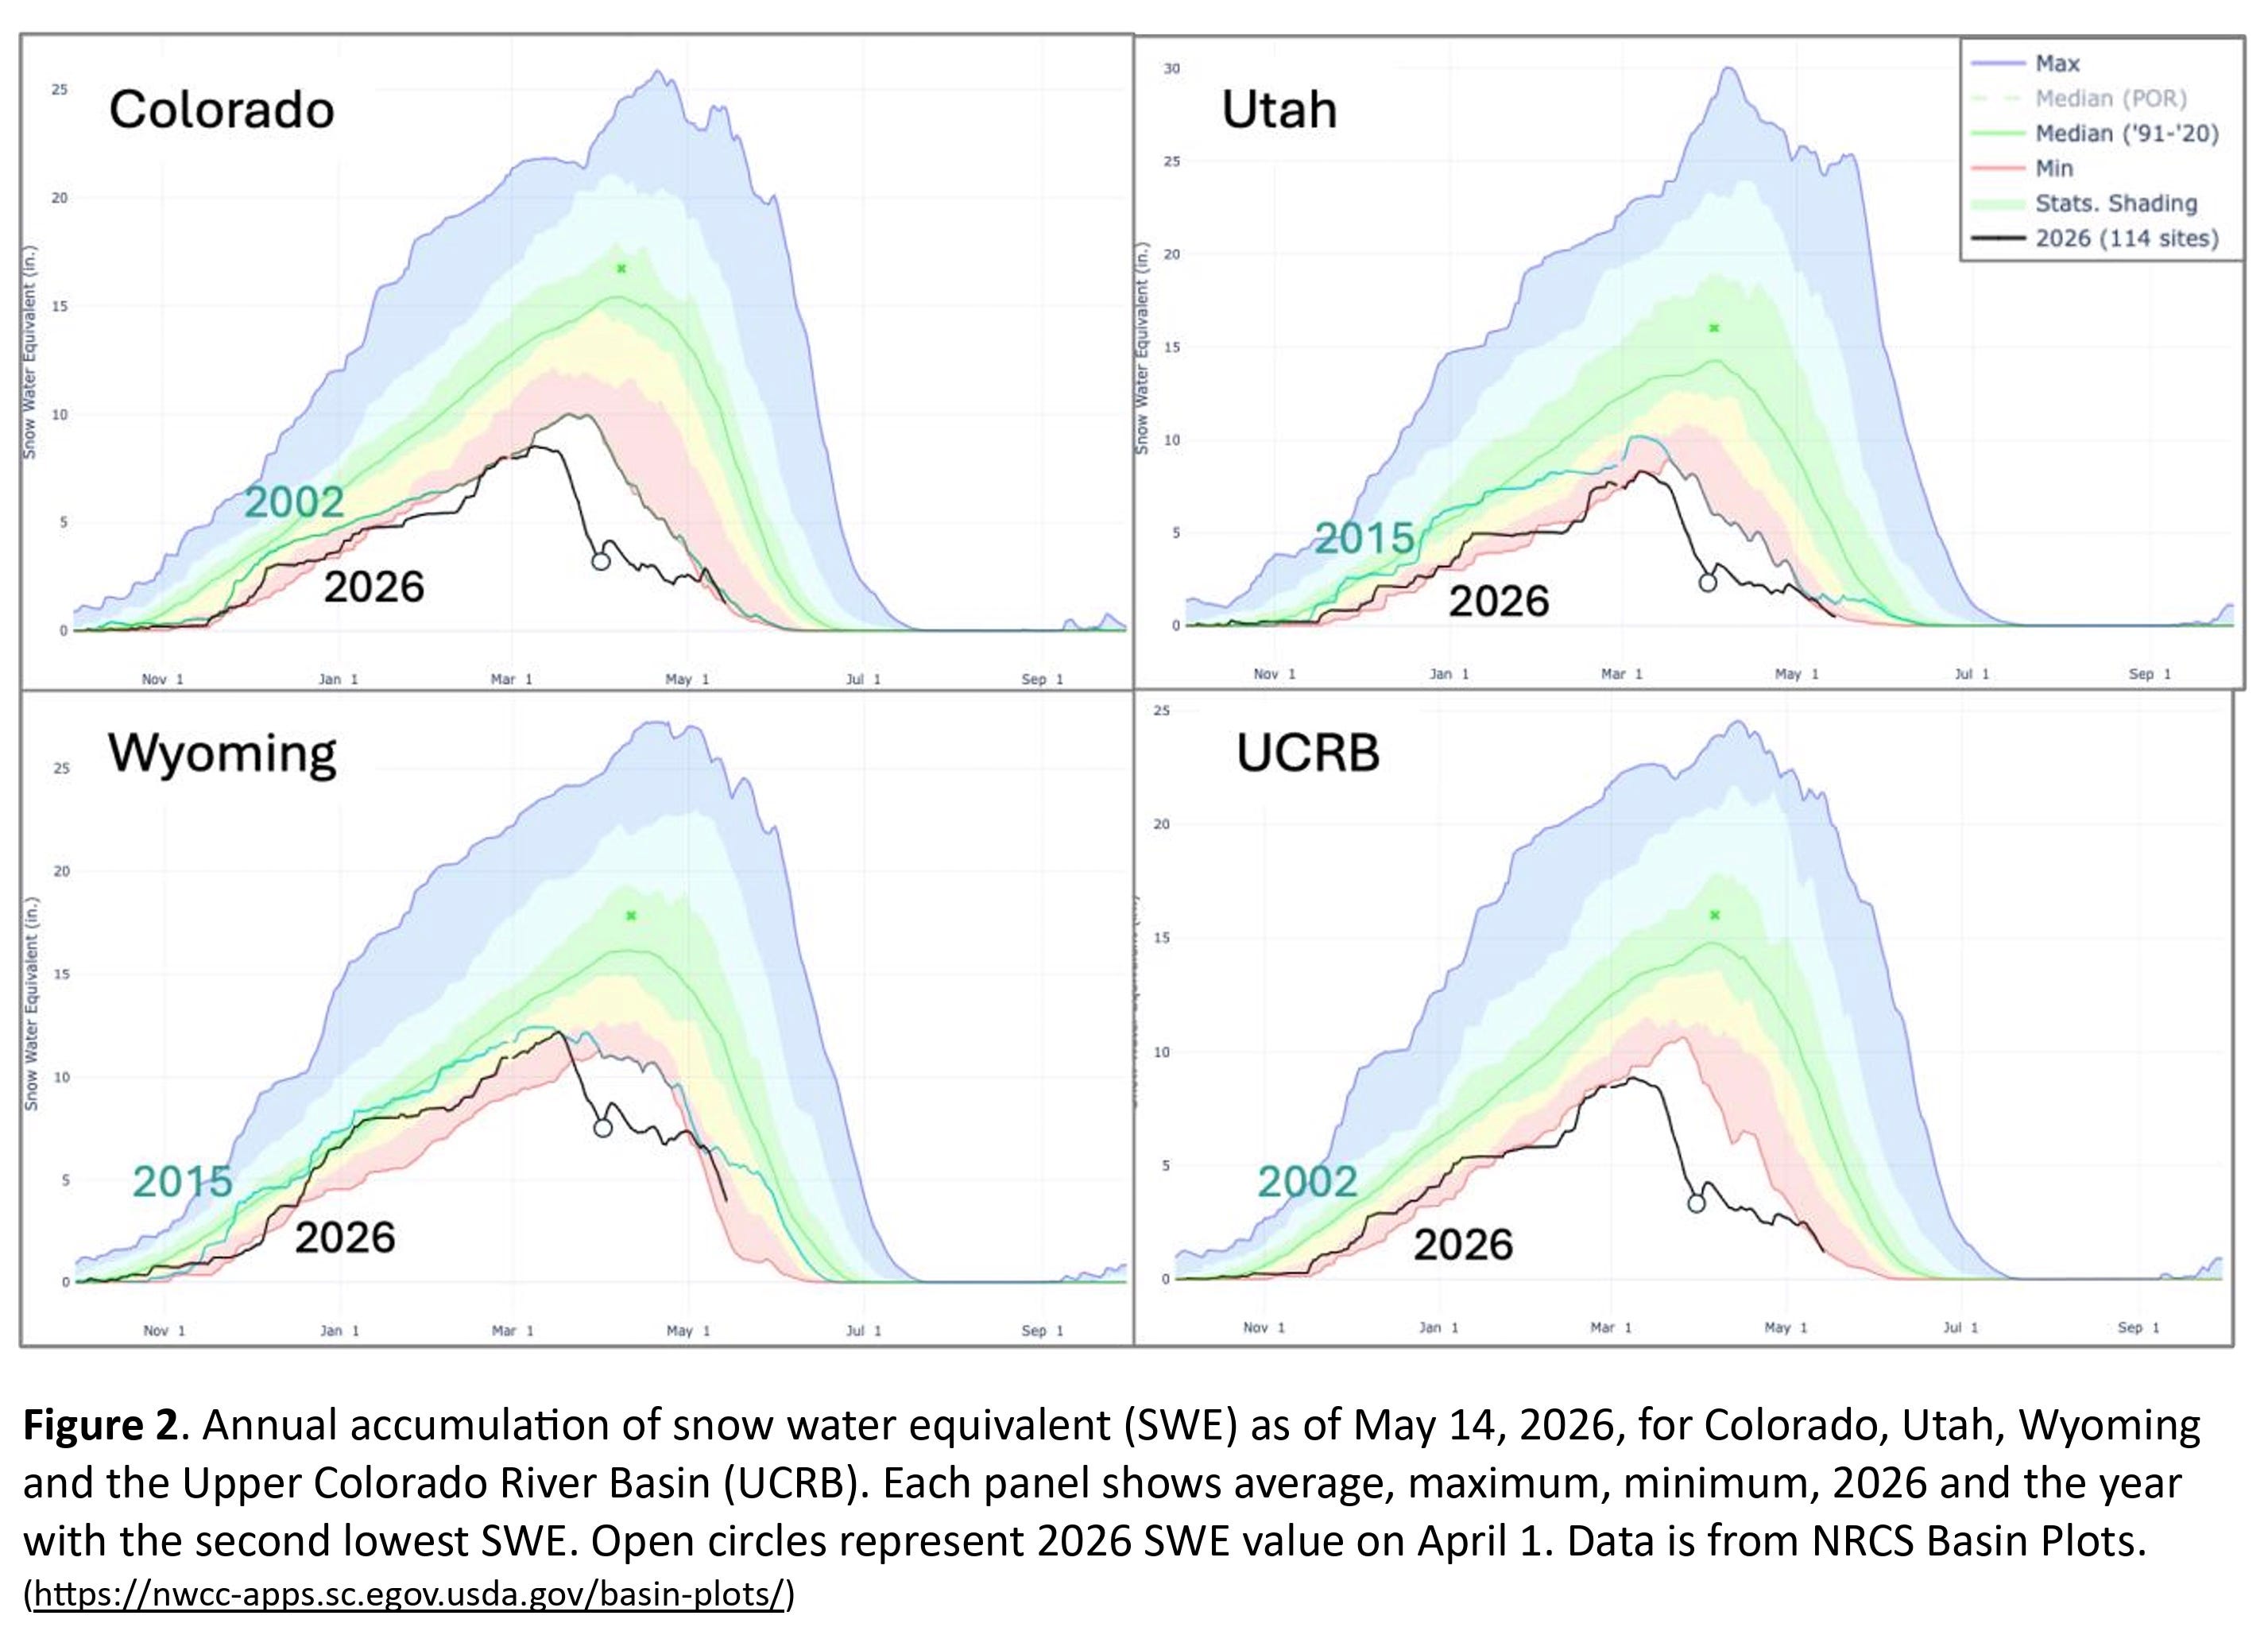
The four charts below show the rise and fall of the snowpack over the water year, with the 2025-2026 season in black and the open circles marking April 1. The graphics also highlight the year with the second-lowest SWE: 2015 for Utah and Wyoming, and 2002 for Colorado and the Upper Colorado River Basin (in the UCRB panel, however, the 2002 line does not appear to be plotted.)
This season, we’ve often heard the term “record-breaking” applied to snowpack measurements that date to the 1980s, when the network of automated SNOTEL stations expanded rapidly. But even longer datasets exist: hand-collected observations at “snow courses” go back decades further.
The charts below show snow course data from 1940 to 2026. The April 1 SWE levels for Colorado, Utah, Wyoming, and the Upper Colorado River Basin all hit record lows (red dots).
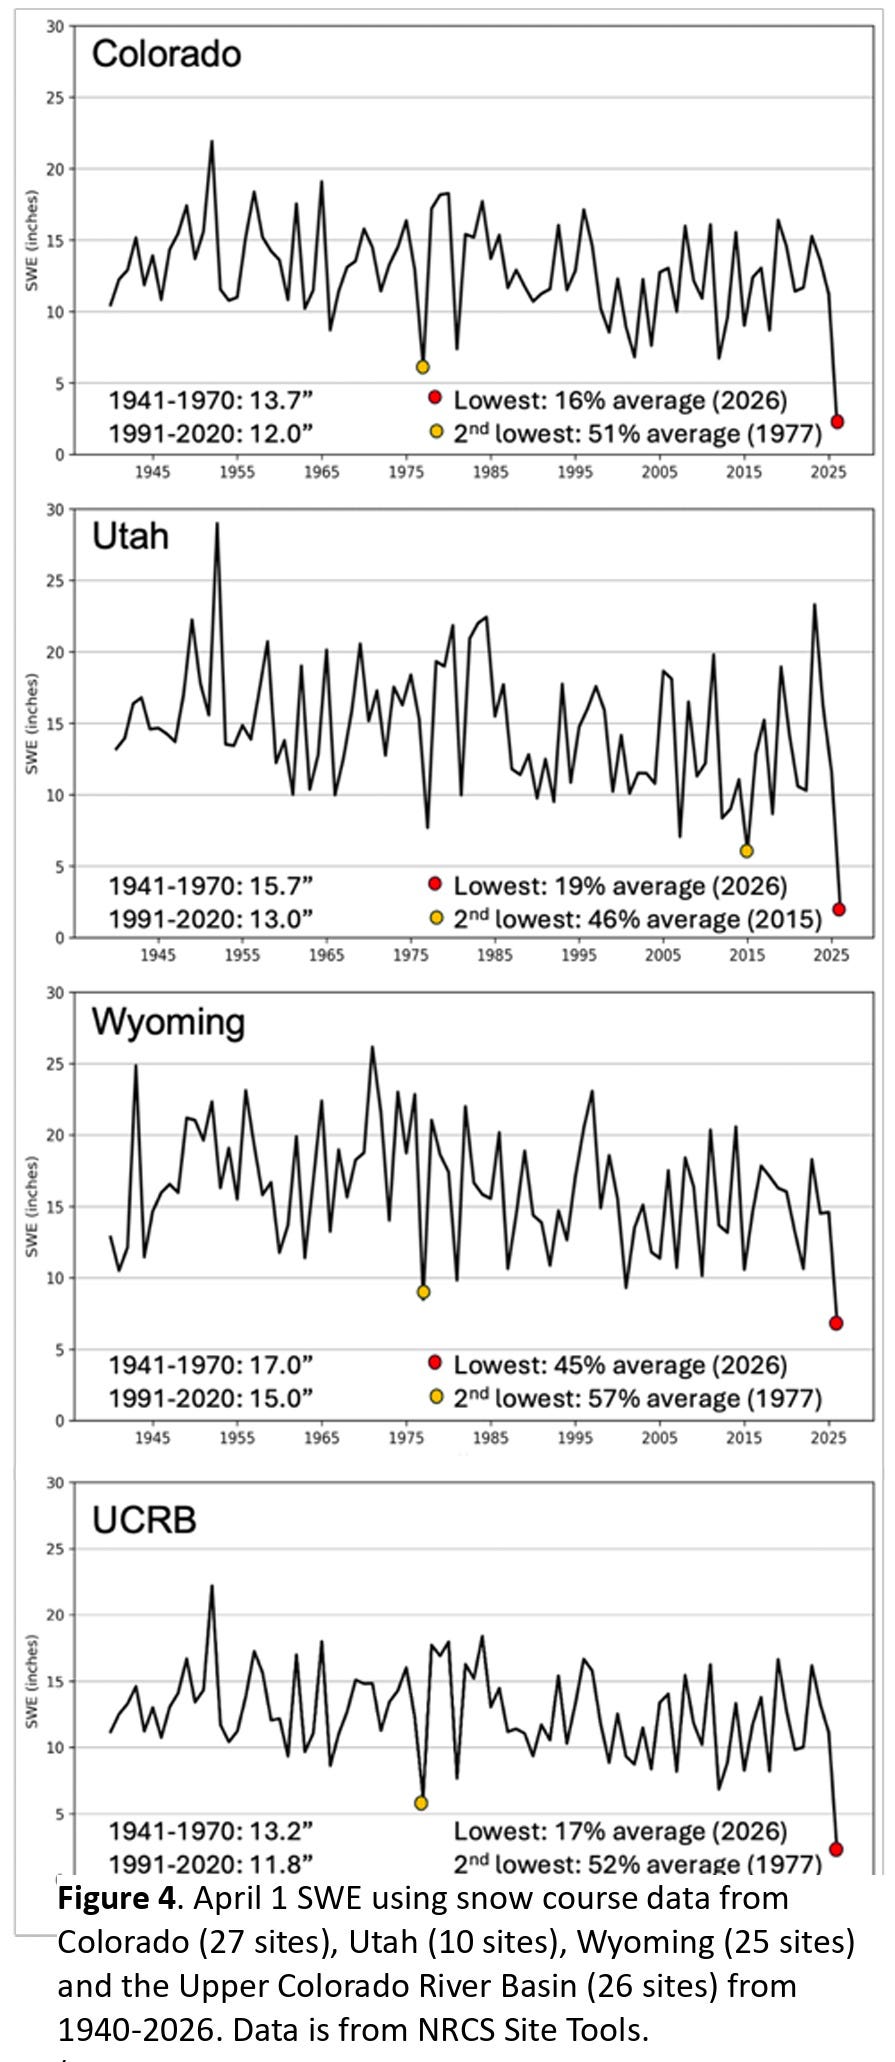
For the Upper Colorado River Basin, this season’s April 1 snowpack was just 17% of average, far below the prior record of 52% in 1977. Interestingly, the bottom chart also shows that average April 1 SWE in the basin declined from 13.2 inches in 1941-1970 to 11.8 inches in 1991-2020, a drop of 10.6%.
“New benchmark low”
The other bleak update, from the National Integrated Drought Information System (NIDIS), surveys the entire West and finds dismal conditions throughout the region.
Here are some of the verbatim lowlights from NIDIS:
“The unprecedented heat wave and rapid snowmelt in March made recovery from the snow drought nearly impossible, despite the April and May snow for some.”
“This water year continues to be the warmest on record (since 1895) in California, Nevada, Utah, Arizona, Colorado, Utah [sic], New Mexico, Wyoming, and Montana; the second warmest in Oregon and Idaho; and the fourth warmest in Washington. The average temperature over the last 5 years was the warmest on record in Wyoming, Arizona, Colorado, Idaho, Montana, Nevada, Utah, and Washington.”
“This year’s peak snowpack will be the new benchmark low for Wyoming, Utah, Colorado, and New Mexico; there are no comparable years. In these states, snow water equivalent (SWE) around April 1, the usual peak date, was 32-53% lower than the previous record low during the SNOTEL era. In Idaho, record warm temperatures pushed snow to only the high elevations, leaving the state with no historical comparison.”
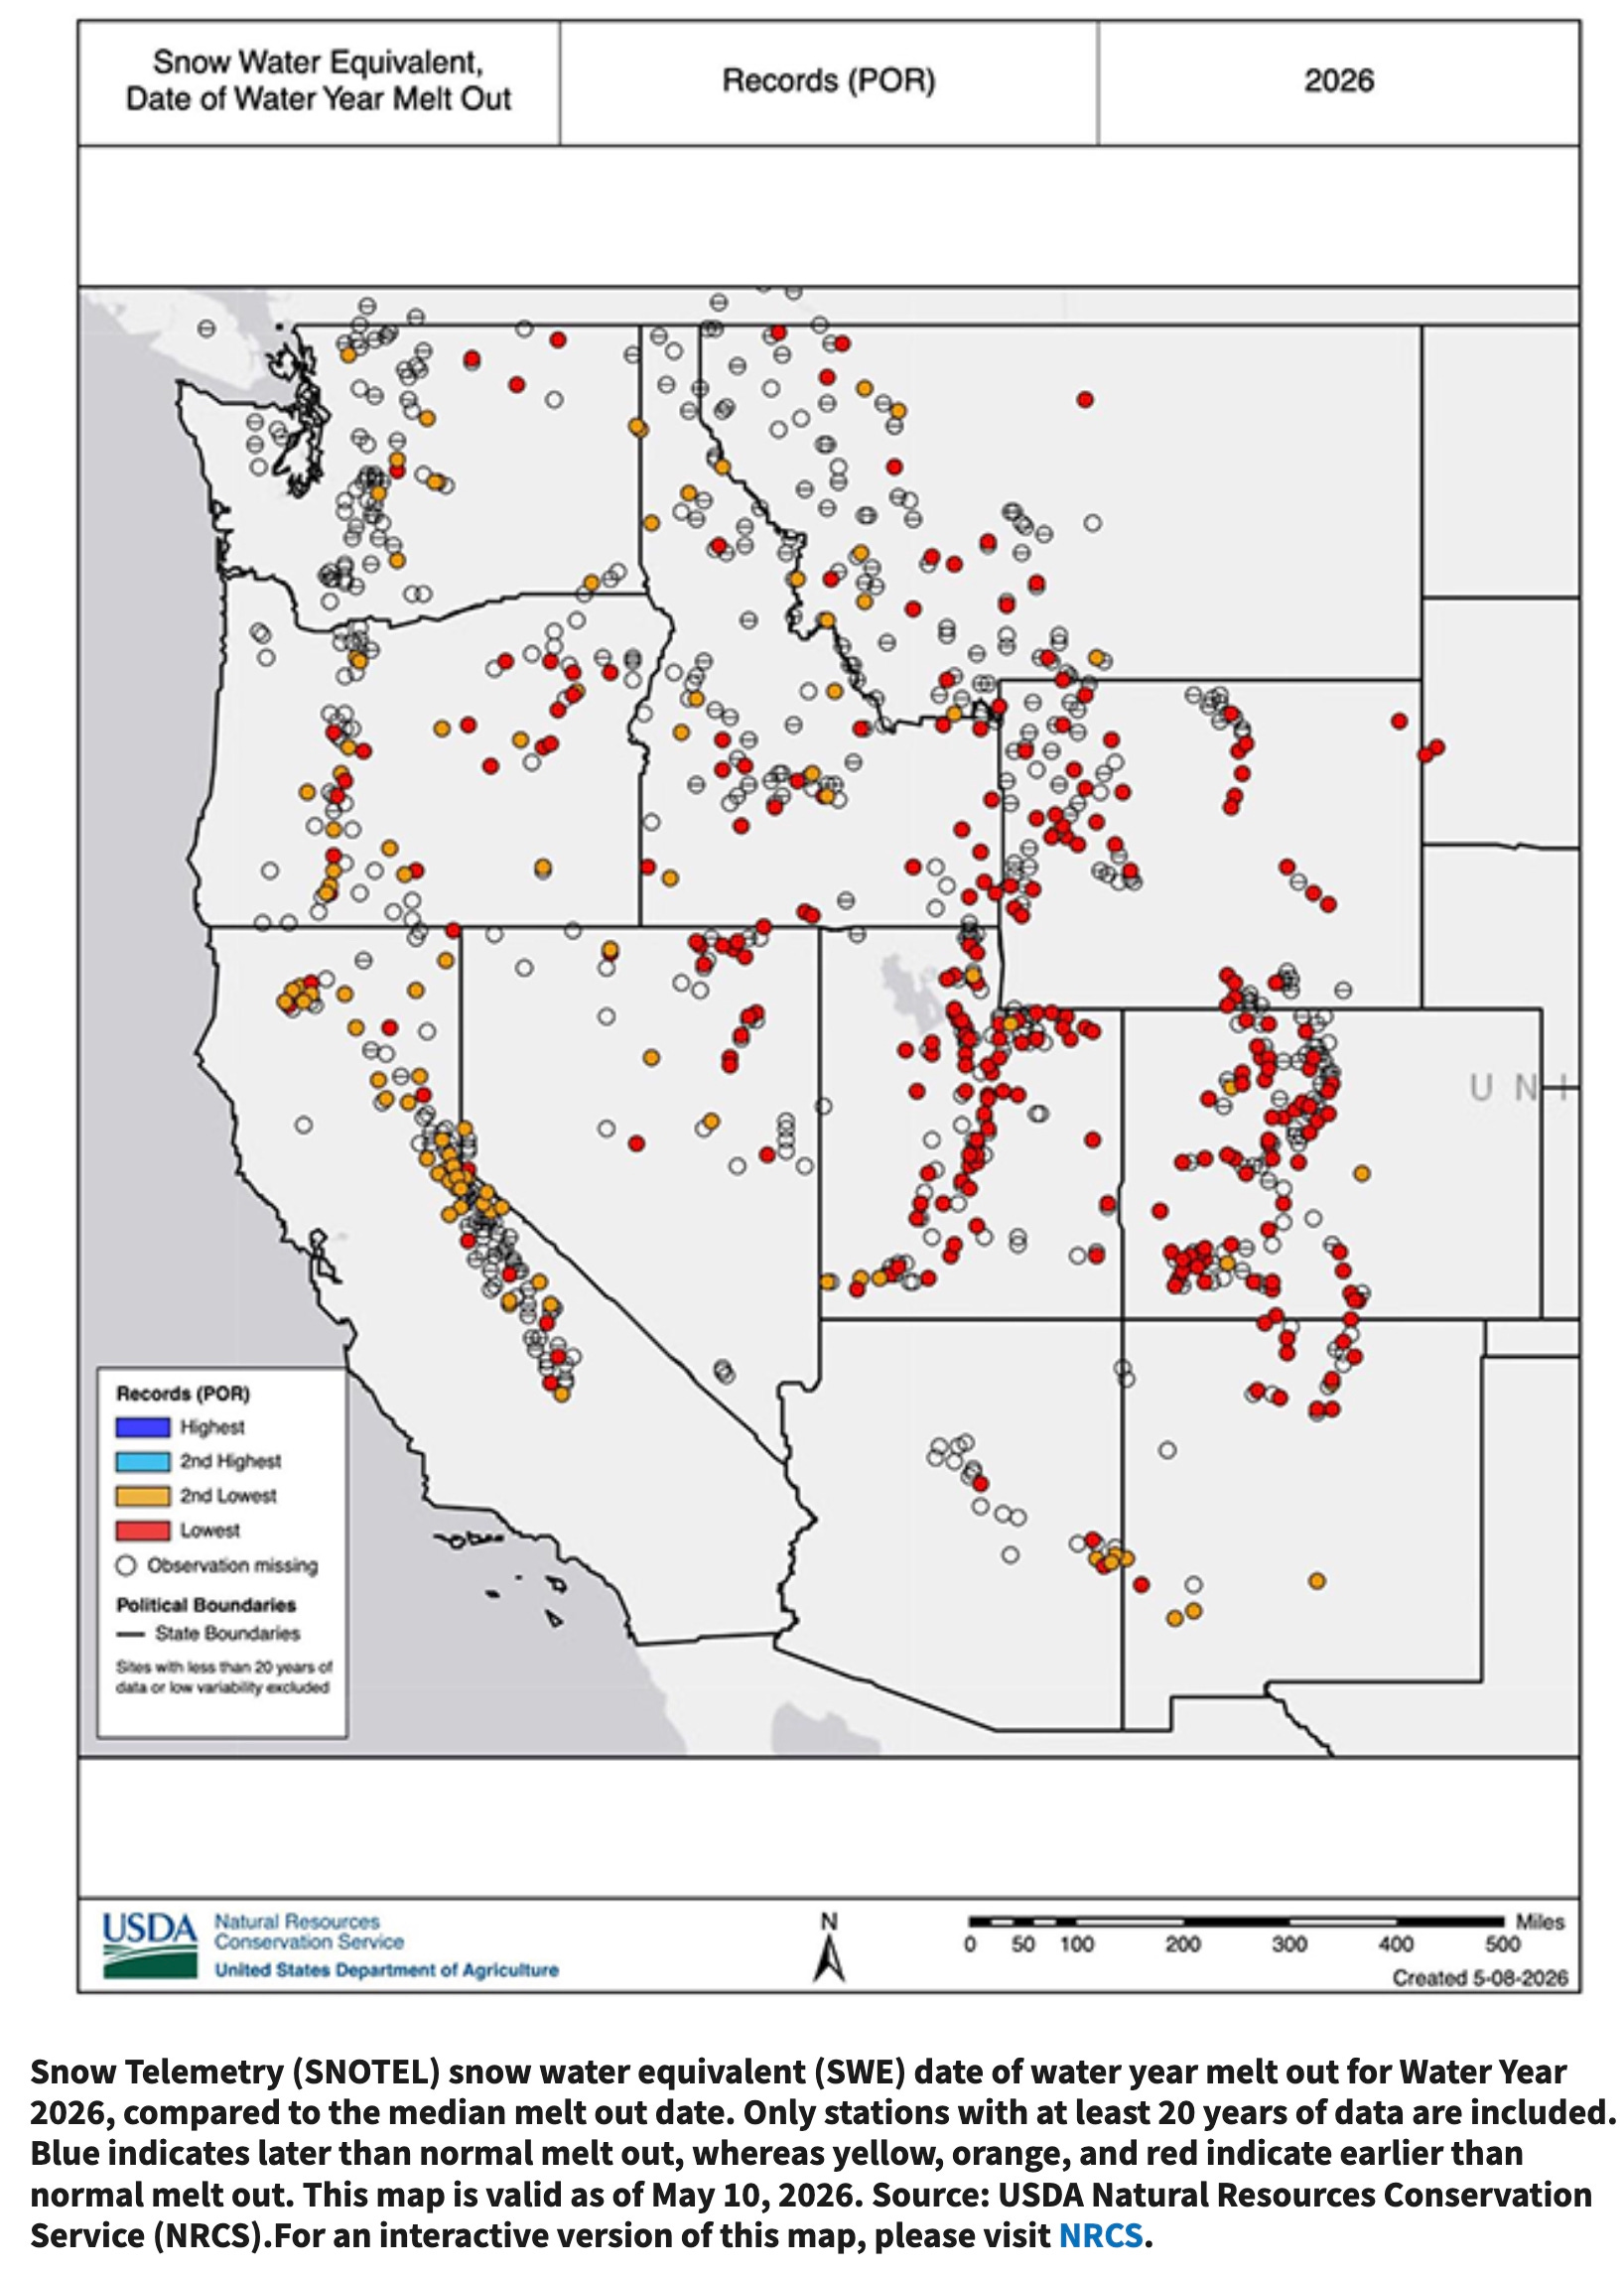
“Earlier-than-normal meltout (snow no longer present) occurred across the Western U.S., with many SNOTEL locations setting a new earliest or second earliest meltout date on record. Water supply forecasts in many watersheds are still forecasted to approach historic lows or at historic lows.
In Oregon, 62 of 73 forecast points are approaching or at historic lows.
In Utah, peak flows occurred and concluded in many streams before the spring runoff season even started.”
In the map below, the red dots mark monitoring stations with record-early meltout dates, while orange dots show stations with the second-earliest dates.
Snow droughts in deeper time
Looking even further back in time, it’s hard to know how this season’s snowpack and runoff compare with other epic low points due to a lack of monitoring data. When we say “record-breaking,” we’re not talking about time immemorial.
But scientists have long used tree rings to infer climate conditions over previous centuries and millennia. Because tree growth is strongly influenced by moisture, researchers have pieced together a deep view of watersheds such as the Colorado River, which is fed mostly by snowmelt.
The charts below from the U.S. Geological Survey show the Colorado River’s flow at Lees Ferry in northern Arizona. The top chart shows the flow back to the late 8th century, with the light blue line based on tree-ring data and the dark blue line representing the instrumental record. The bottom chart starts in the late 19th century (these visualizations end in 2013).
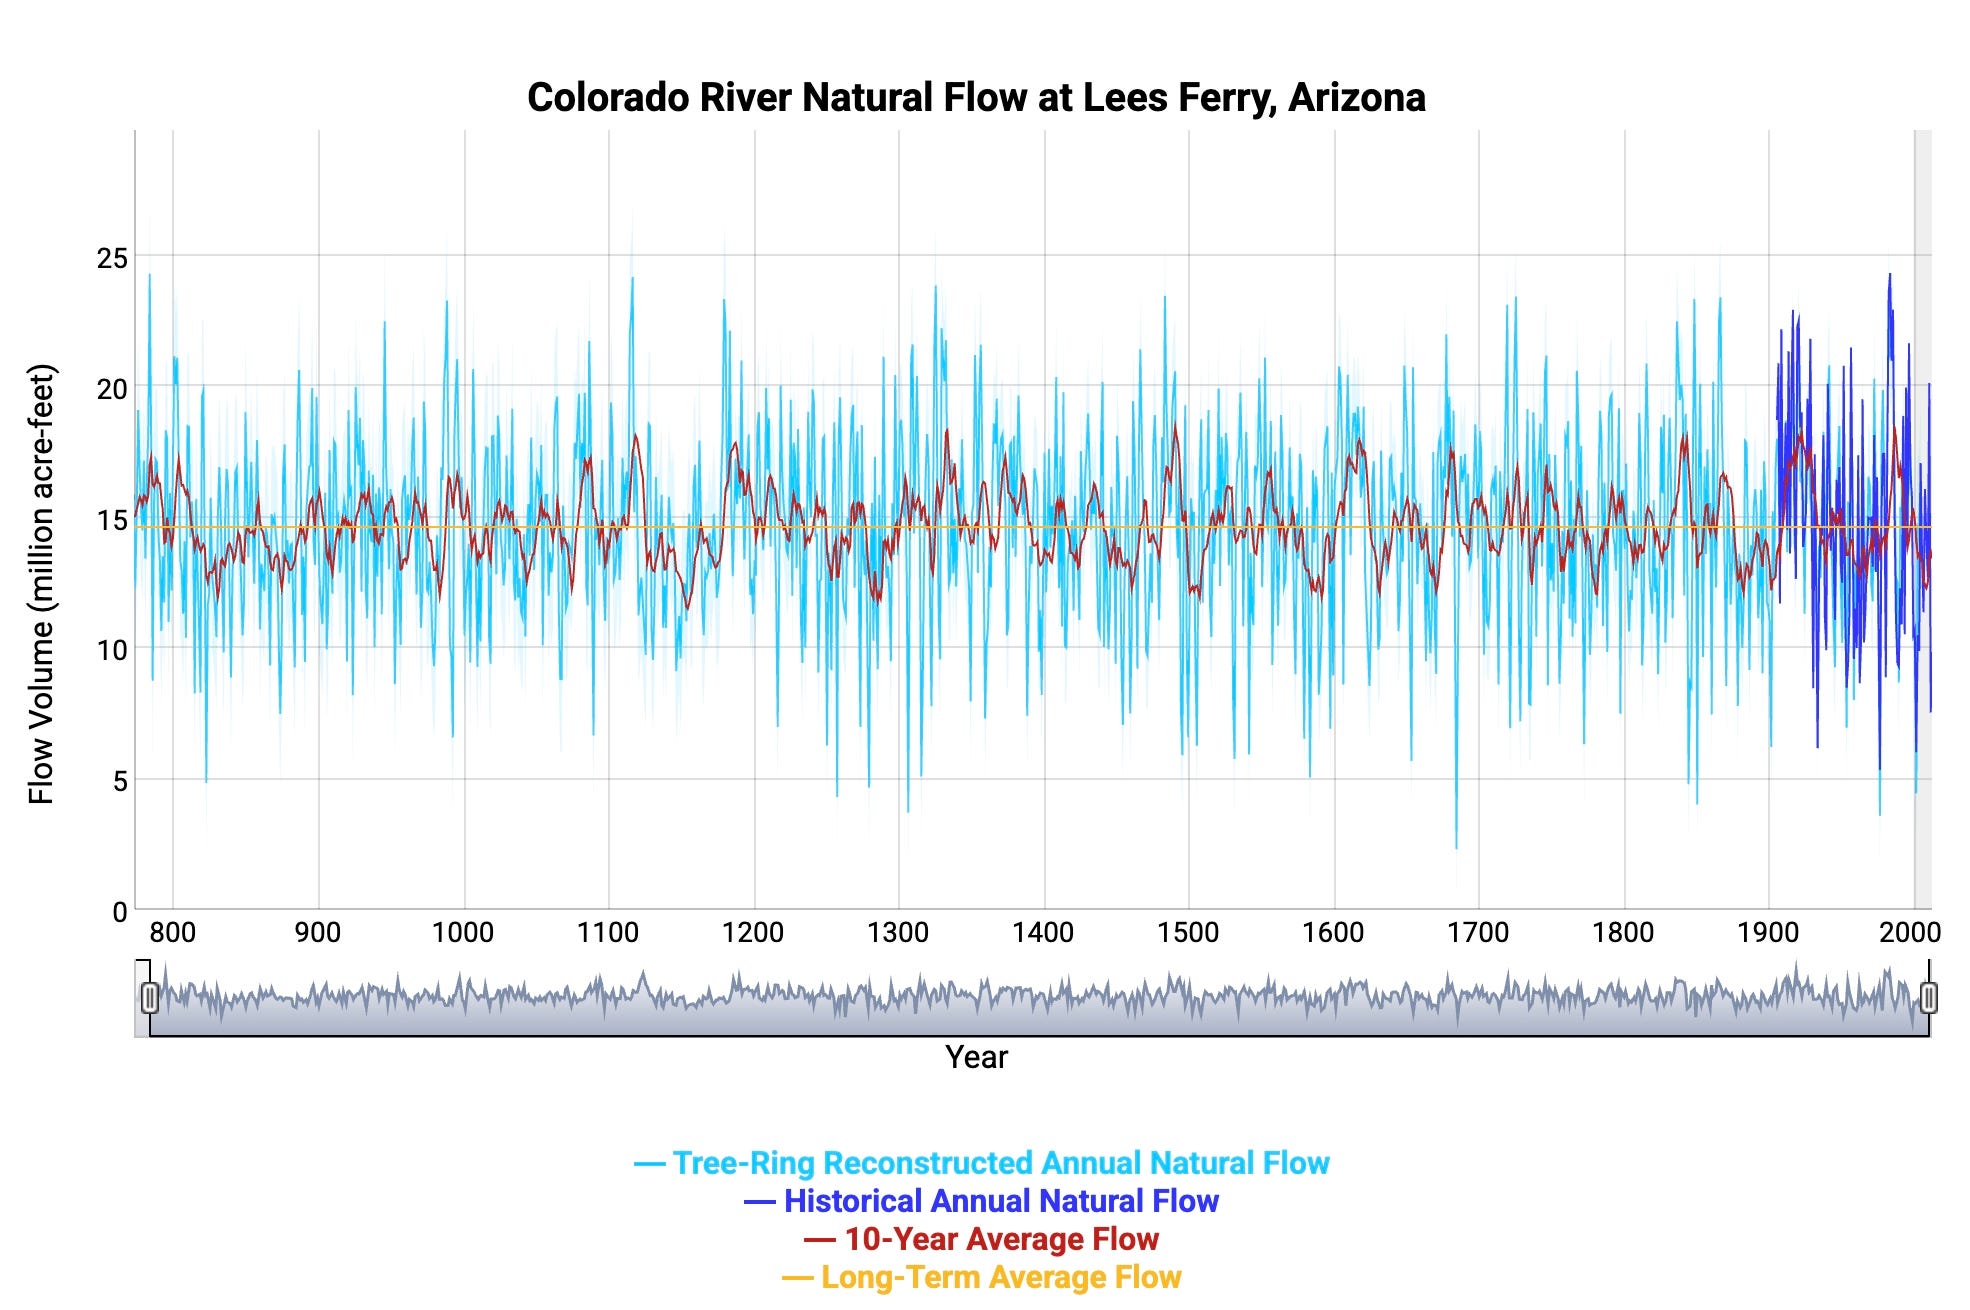
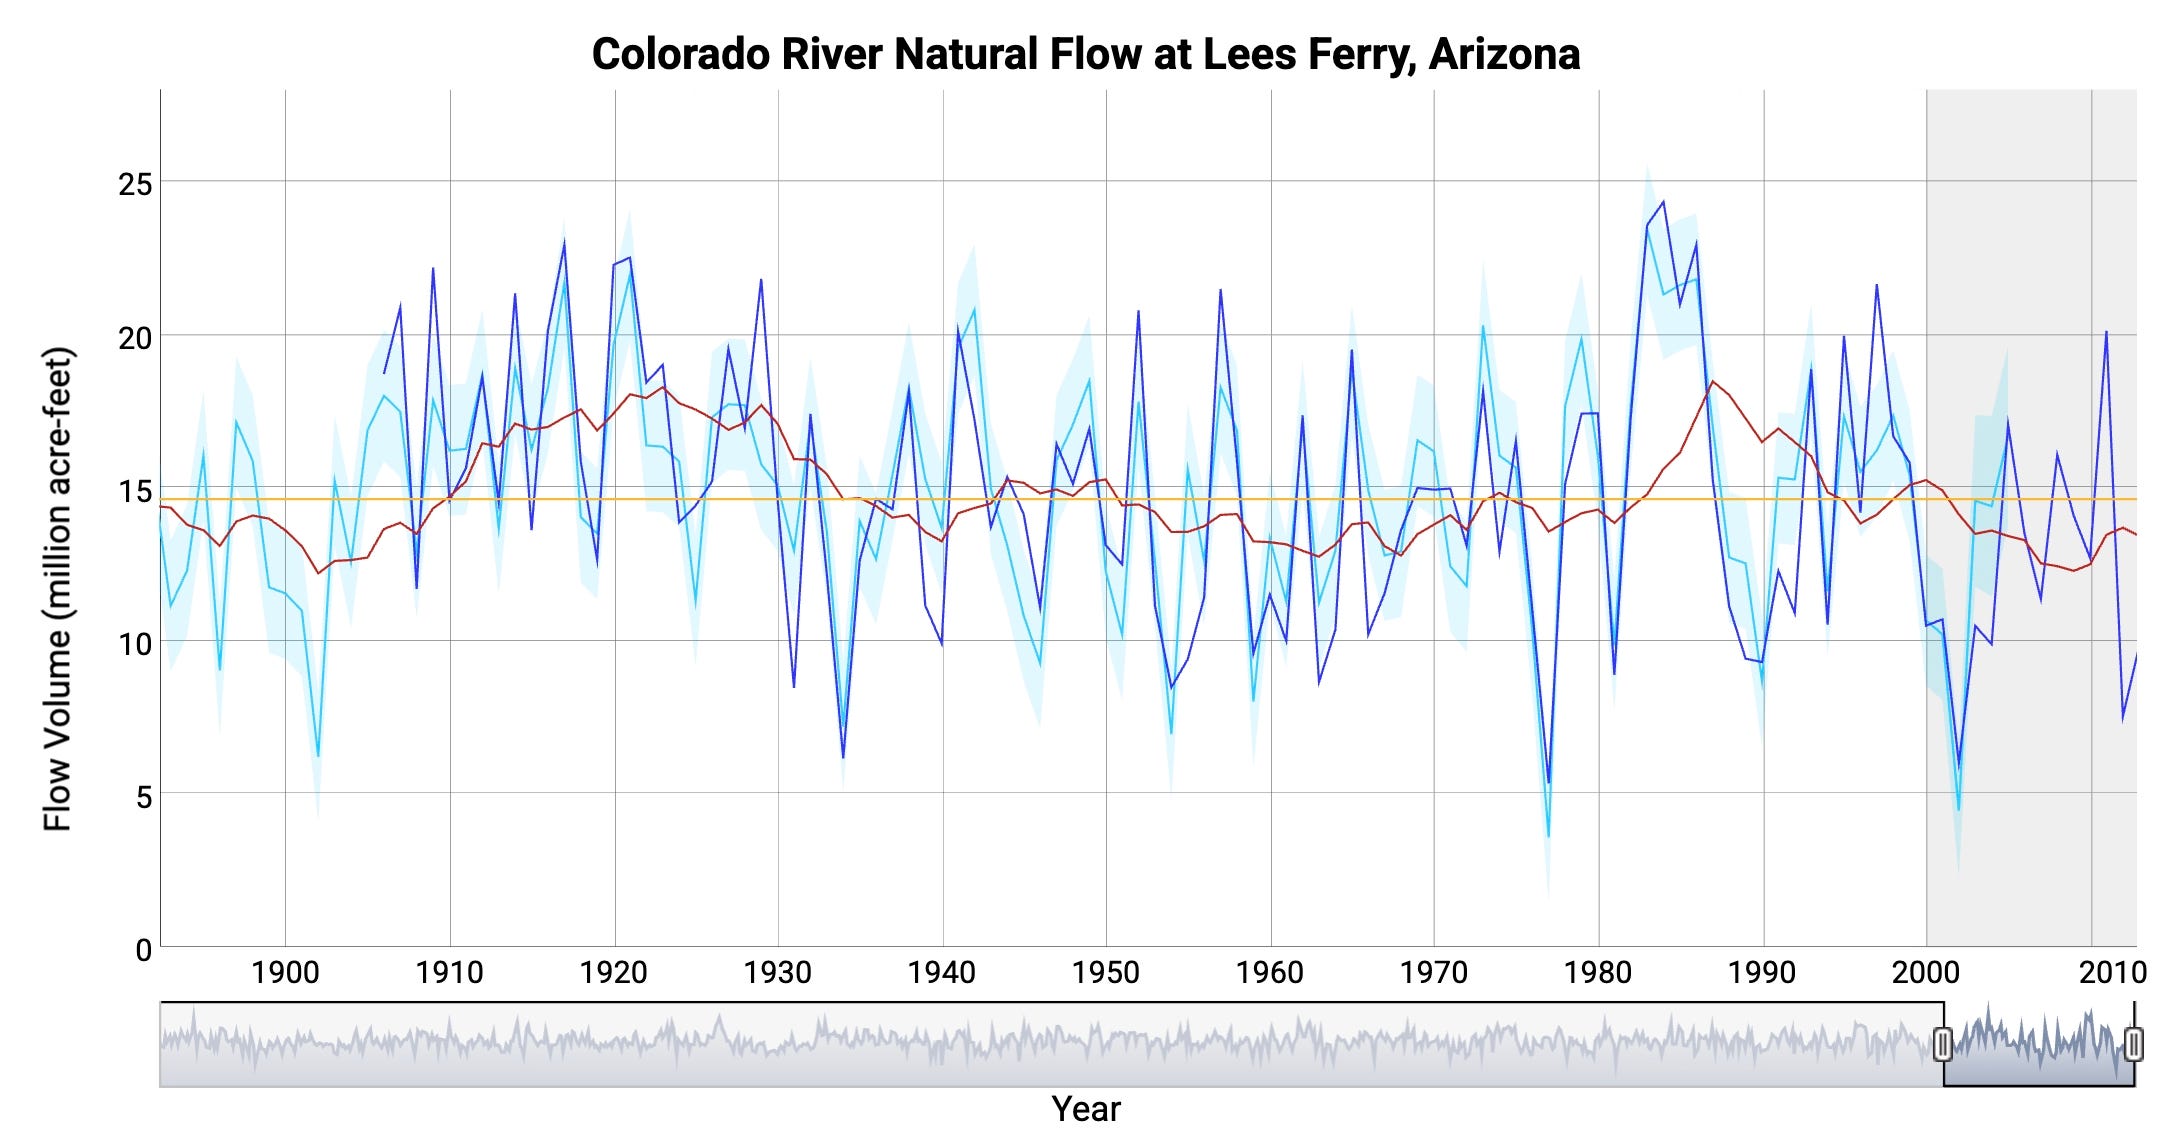
The Lees Ferry data may be an imperfect proxy for Upper Colorado River Basin snowpack levels, but both charts show the Colorado River’s flow is naturally noisy and subject to extreme swings. The top graphic looks like a seismograph tracing the vibrations of an earthquake. In the bottom image, you can see the terrible runoff year of 2002—but this year’s forecast for inflows to Lake Powell are even worse, at just 13% of average.
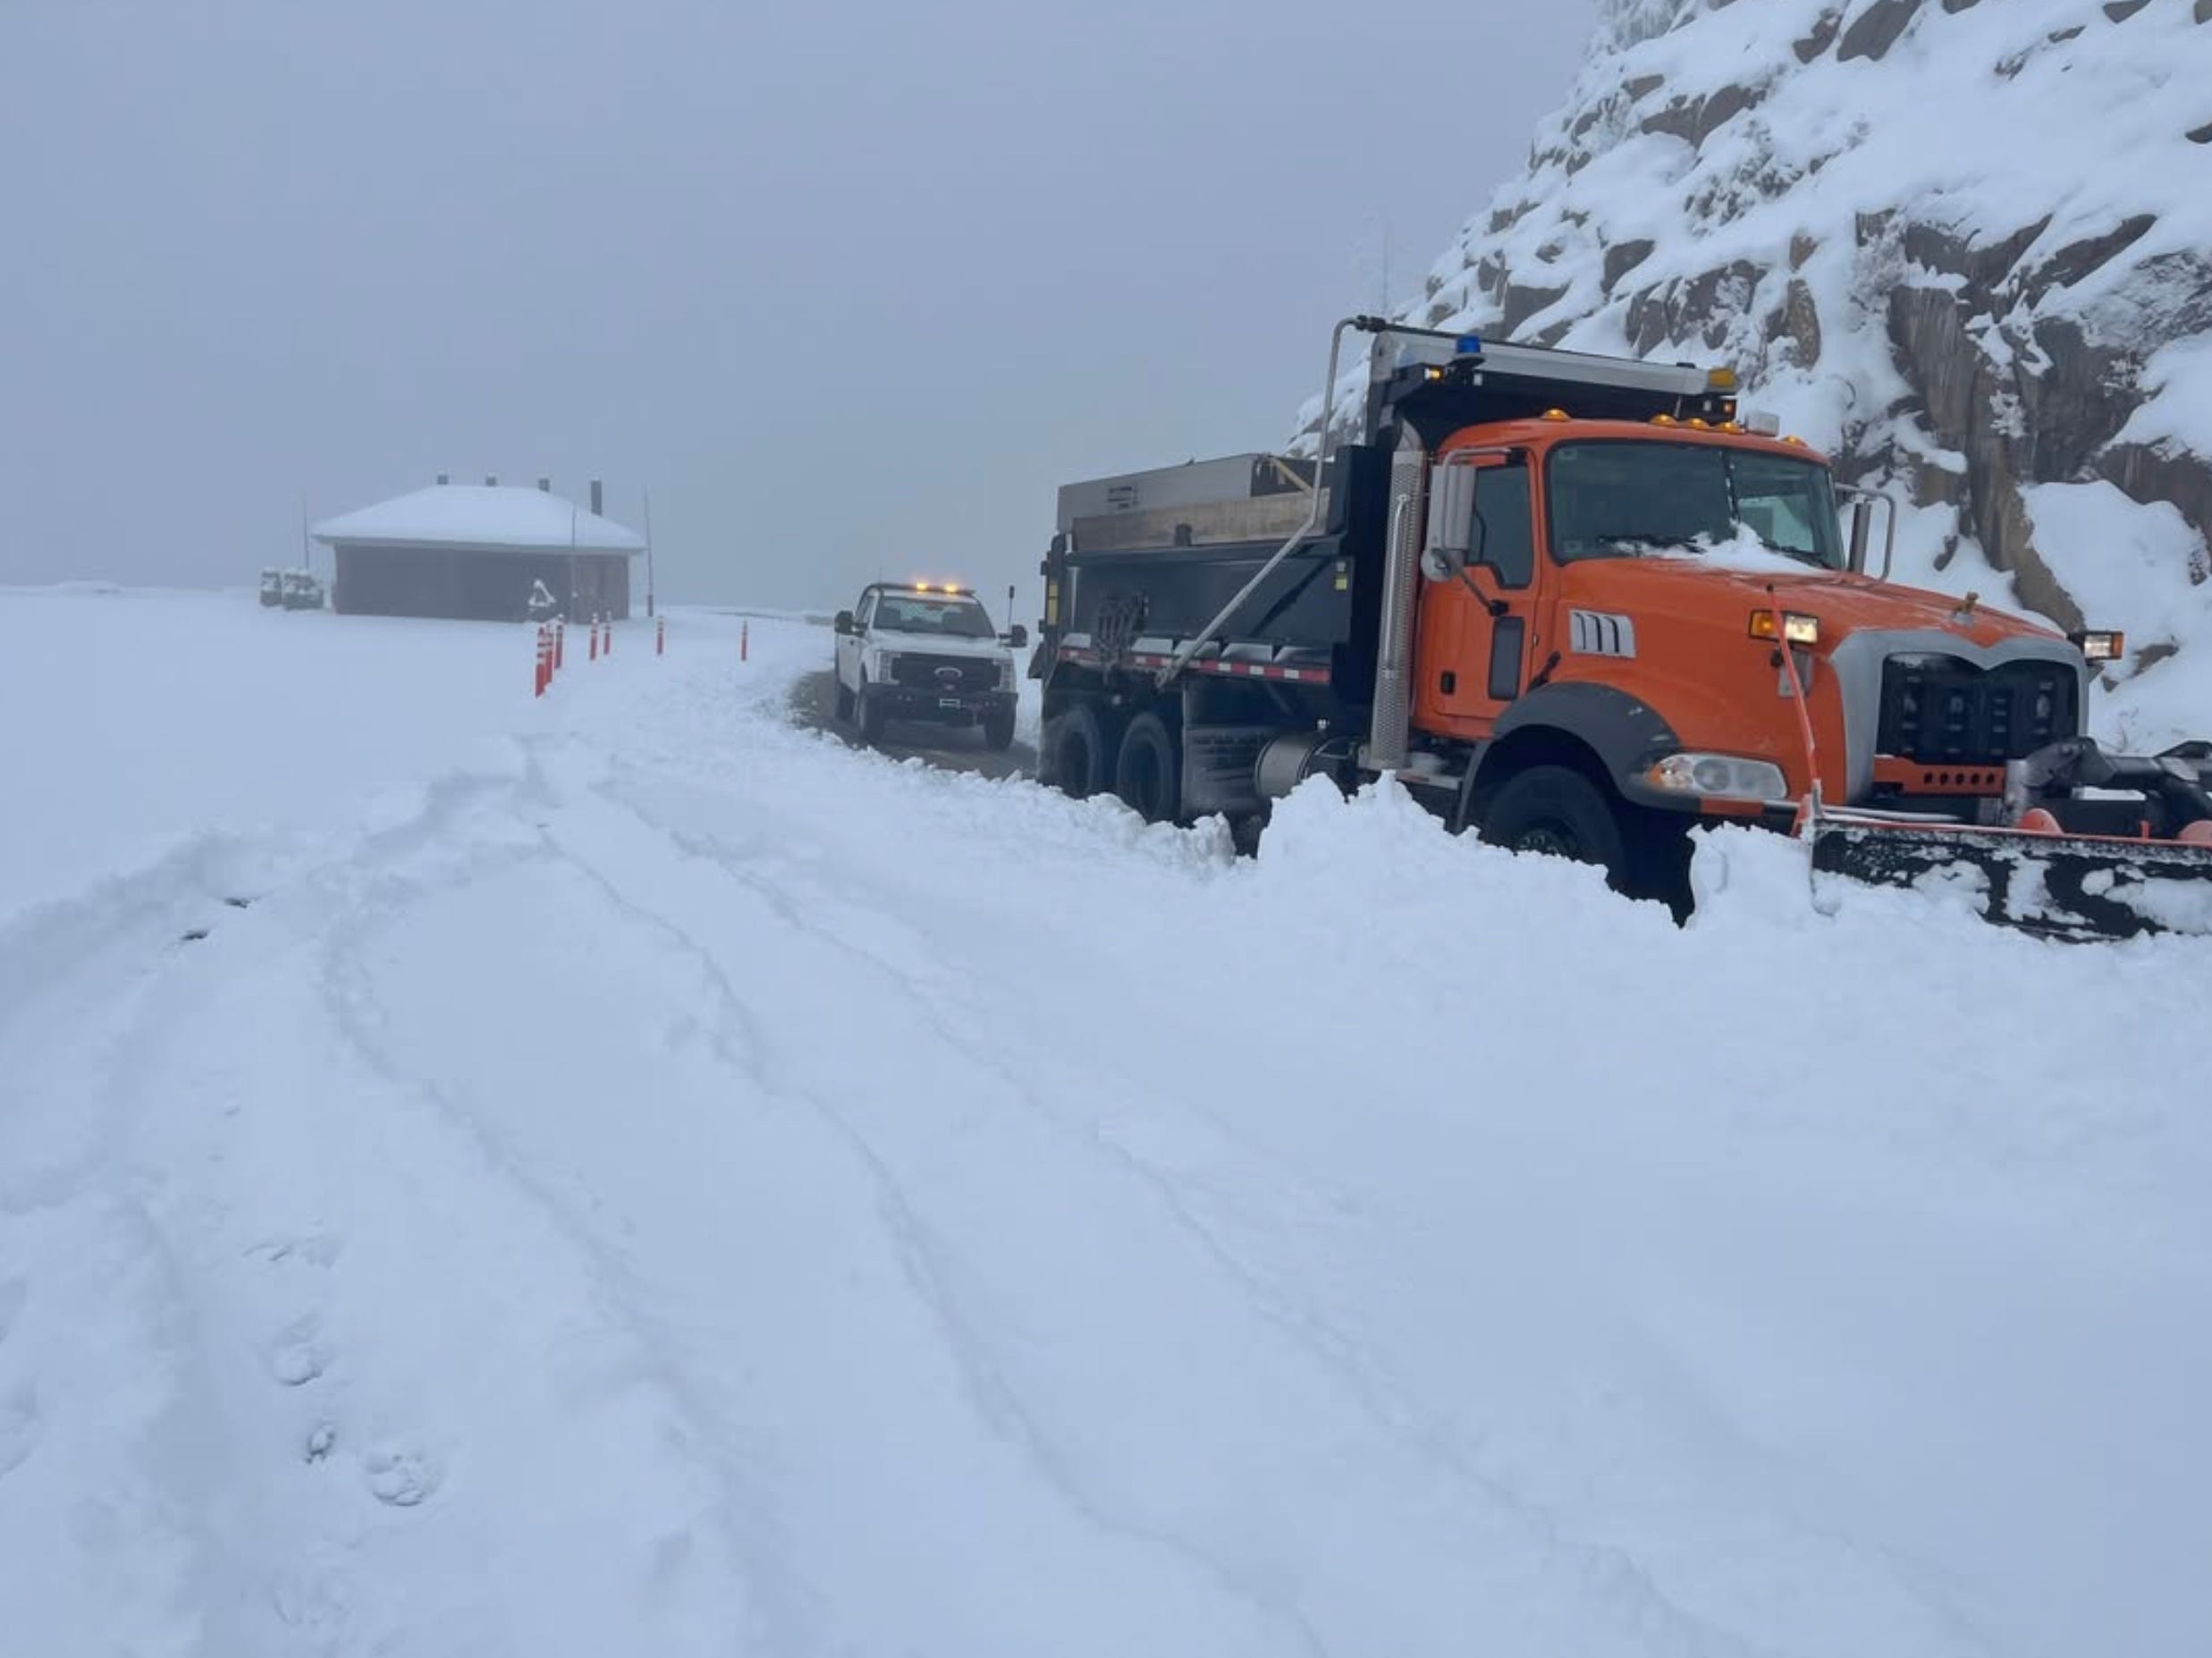
In parts of Colorado, May has delivered a couple of decent snowstorms. It’s felt a little like a last-place team winning a few meaningless games at the end of the season. But that storminess added desperately needed water to the system, delayed snowpack melting, and moistened soils—it’s better than nothing.
The photo below shows conditions on May 19 in Rocky Mountain National Park, where more than a foot of new snow delayed the opening of Trail Ridge Road.
At the loftiest elevations in Colorado, snow is possible in any month of the year, so we may not have seen the final flakes of the season.
Durango ✈︎ Denver aerial photos
There’s so much to dread about air travel these days, but the window seat can be a saving grace.
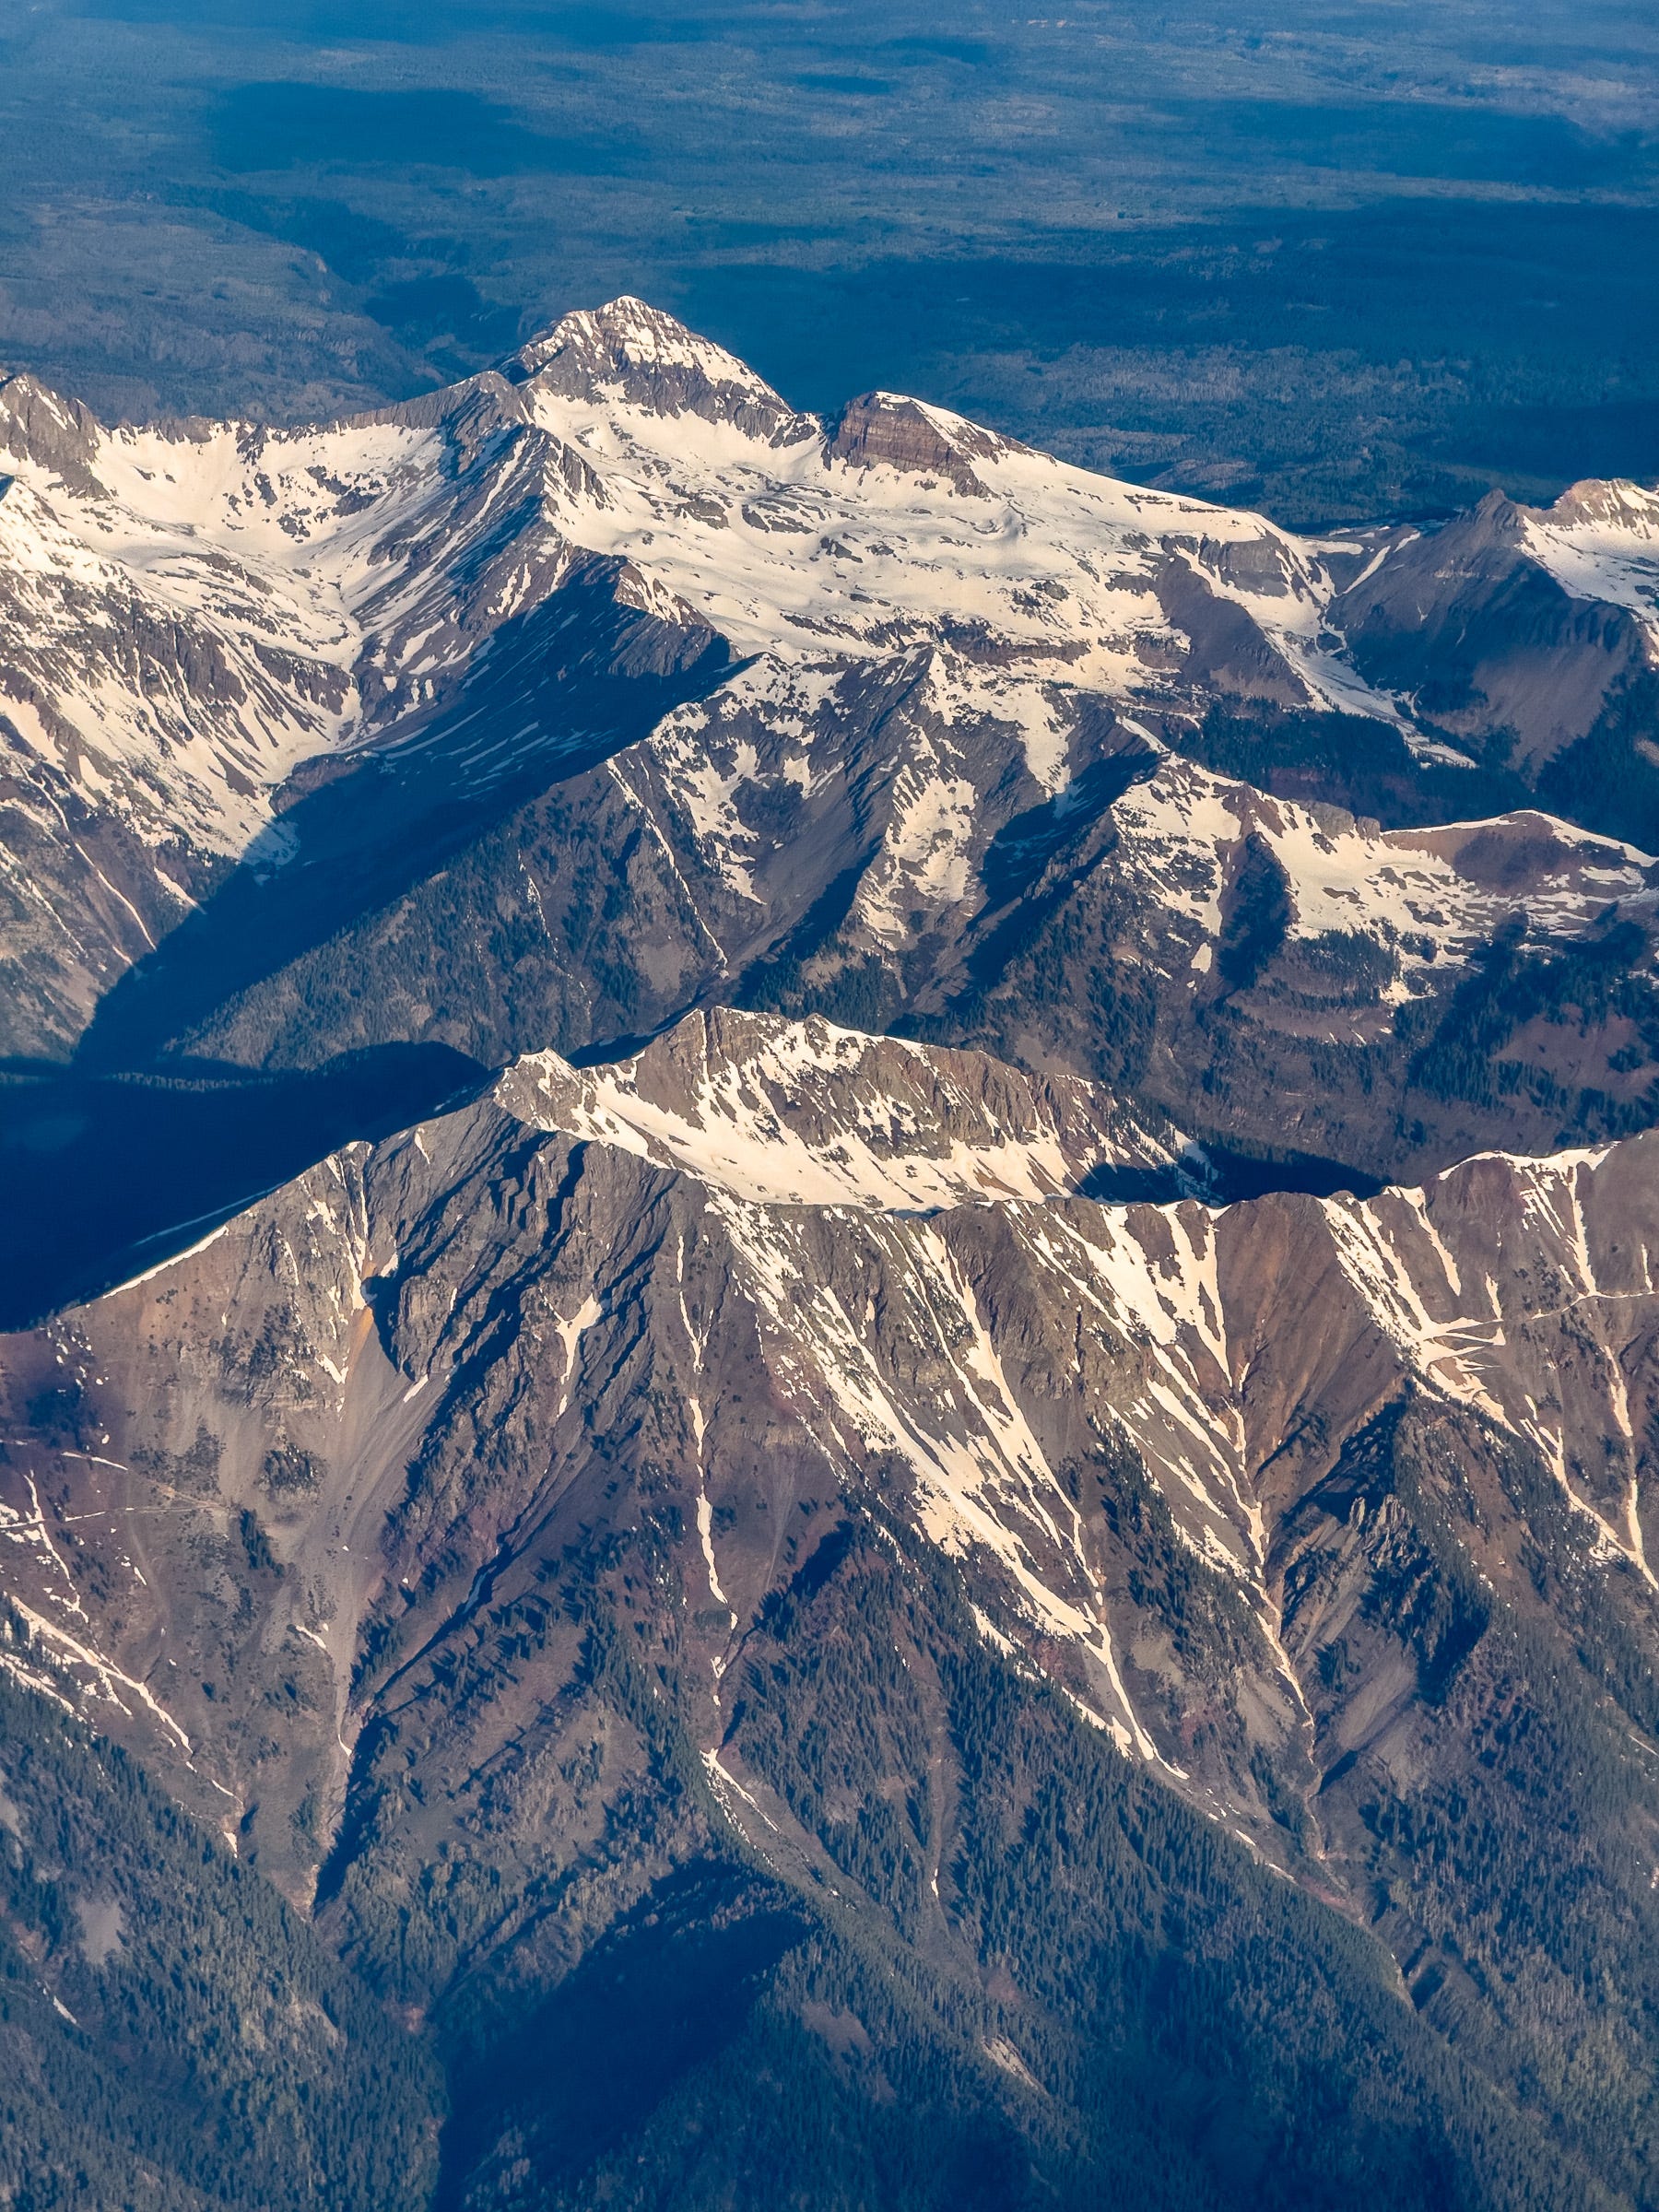
Our 7 a.m. Durango-to-Denver flight on May 13 began with a more westerly route than usual, putting the plane closer to the La Platas, northwest of Durango. I’ve climbed a few of the peaks and, as the photo below shows, this is steep, gorgeous country.
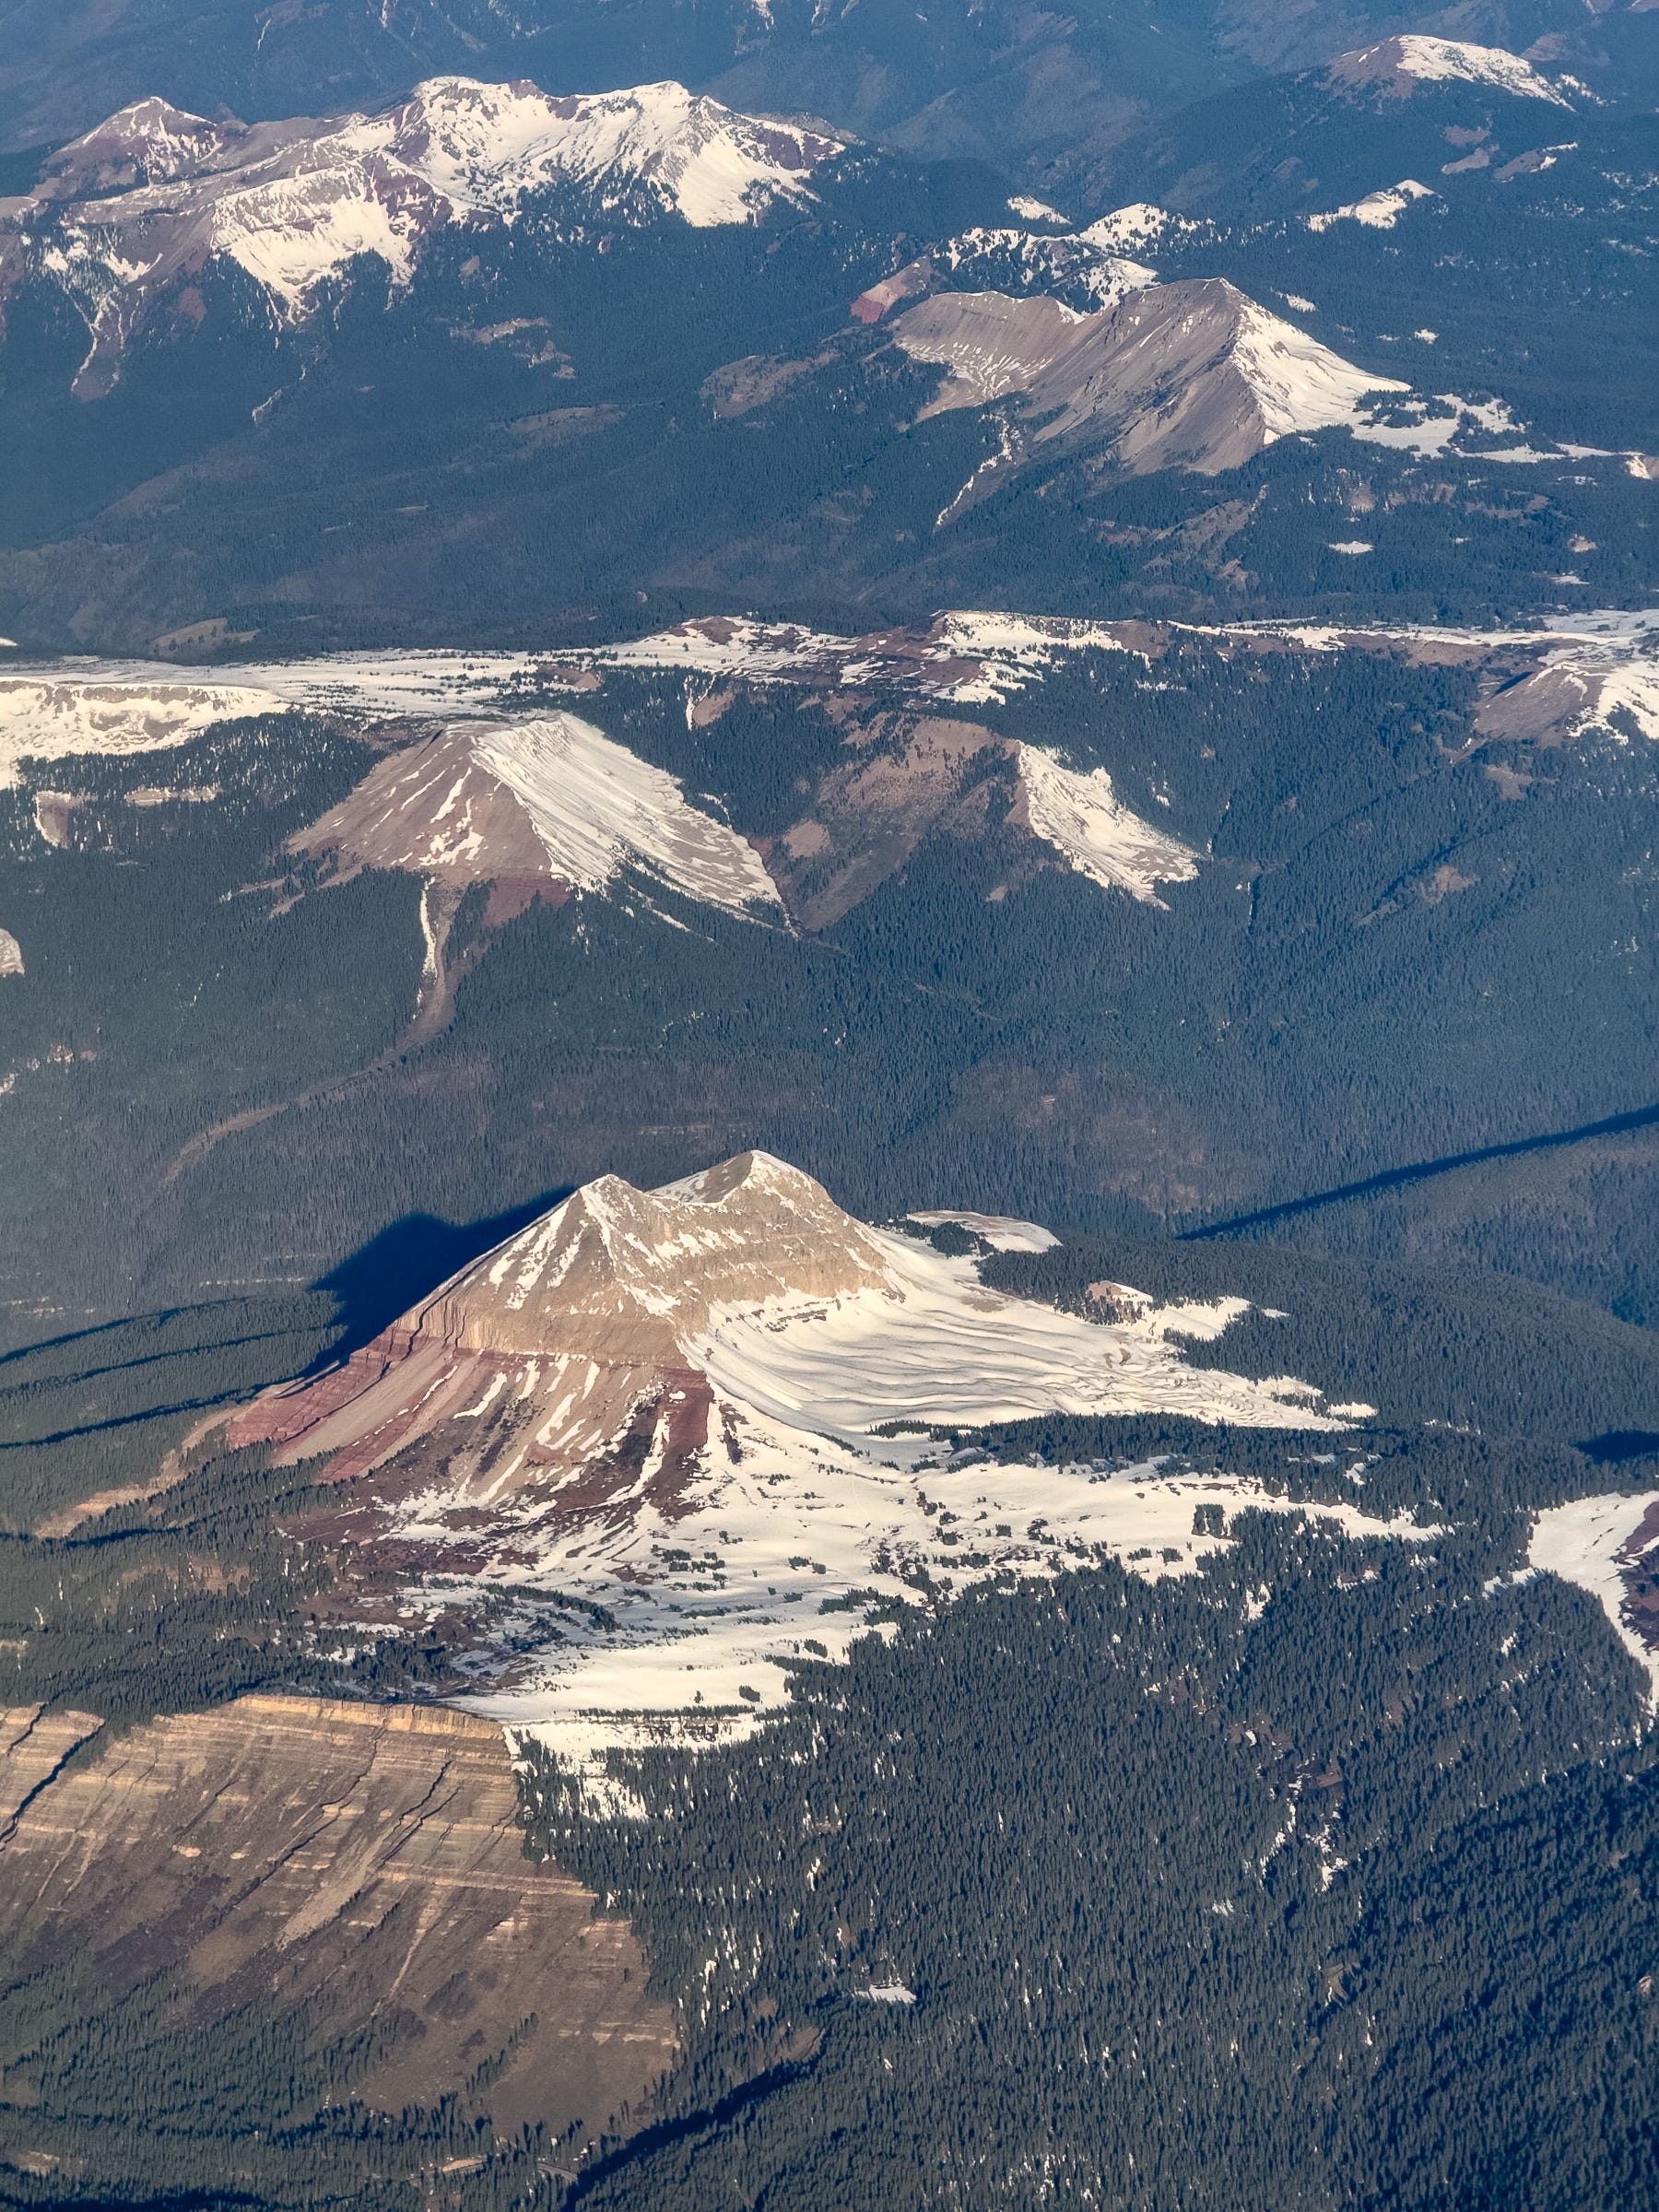
Engineer Mountain, the 12,968-foot pyramidal peak toward the bottom of the photo below, is a kind of photographic talisman for me. It exerts a magnetic pull on my lens whenever I’m skiing or biking at Purgatory. You can see how the remaining snow was largely confined to the shadier, north-facing slopes of Engineer and other nearby mountains.
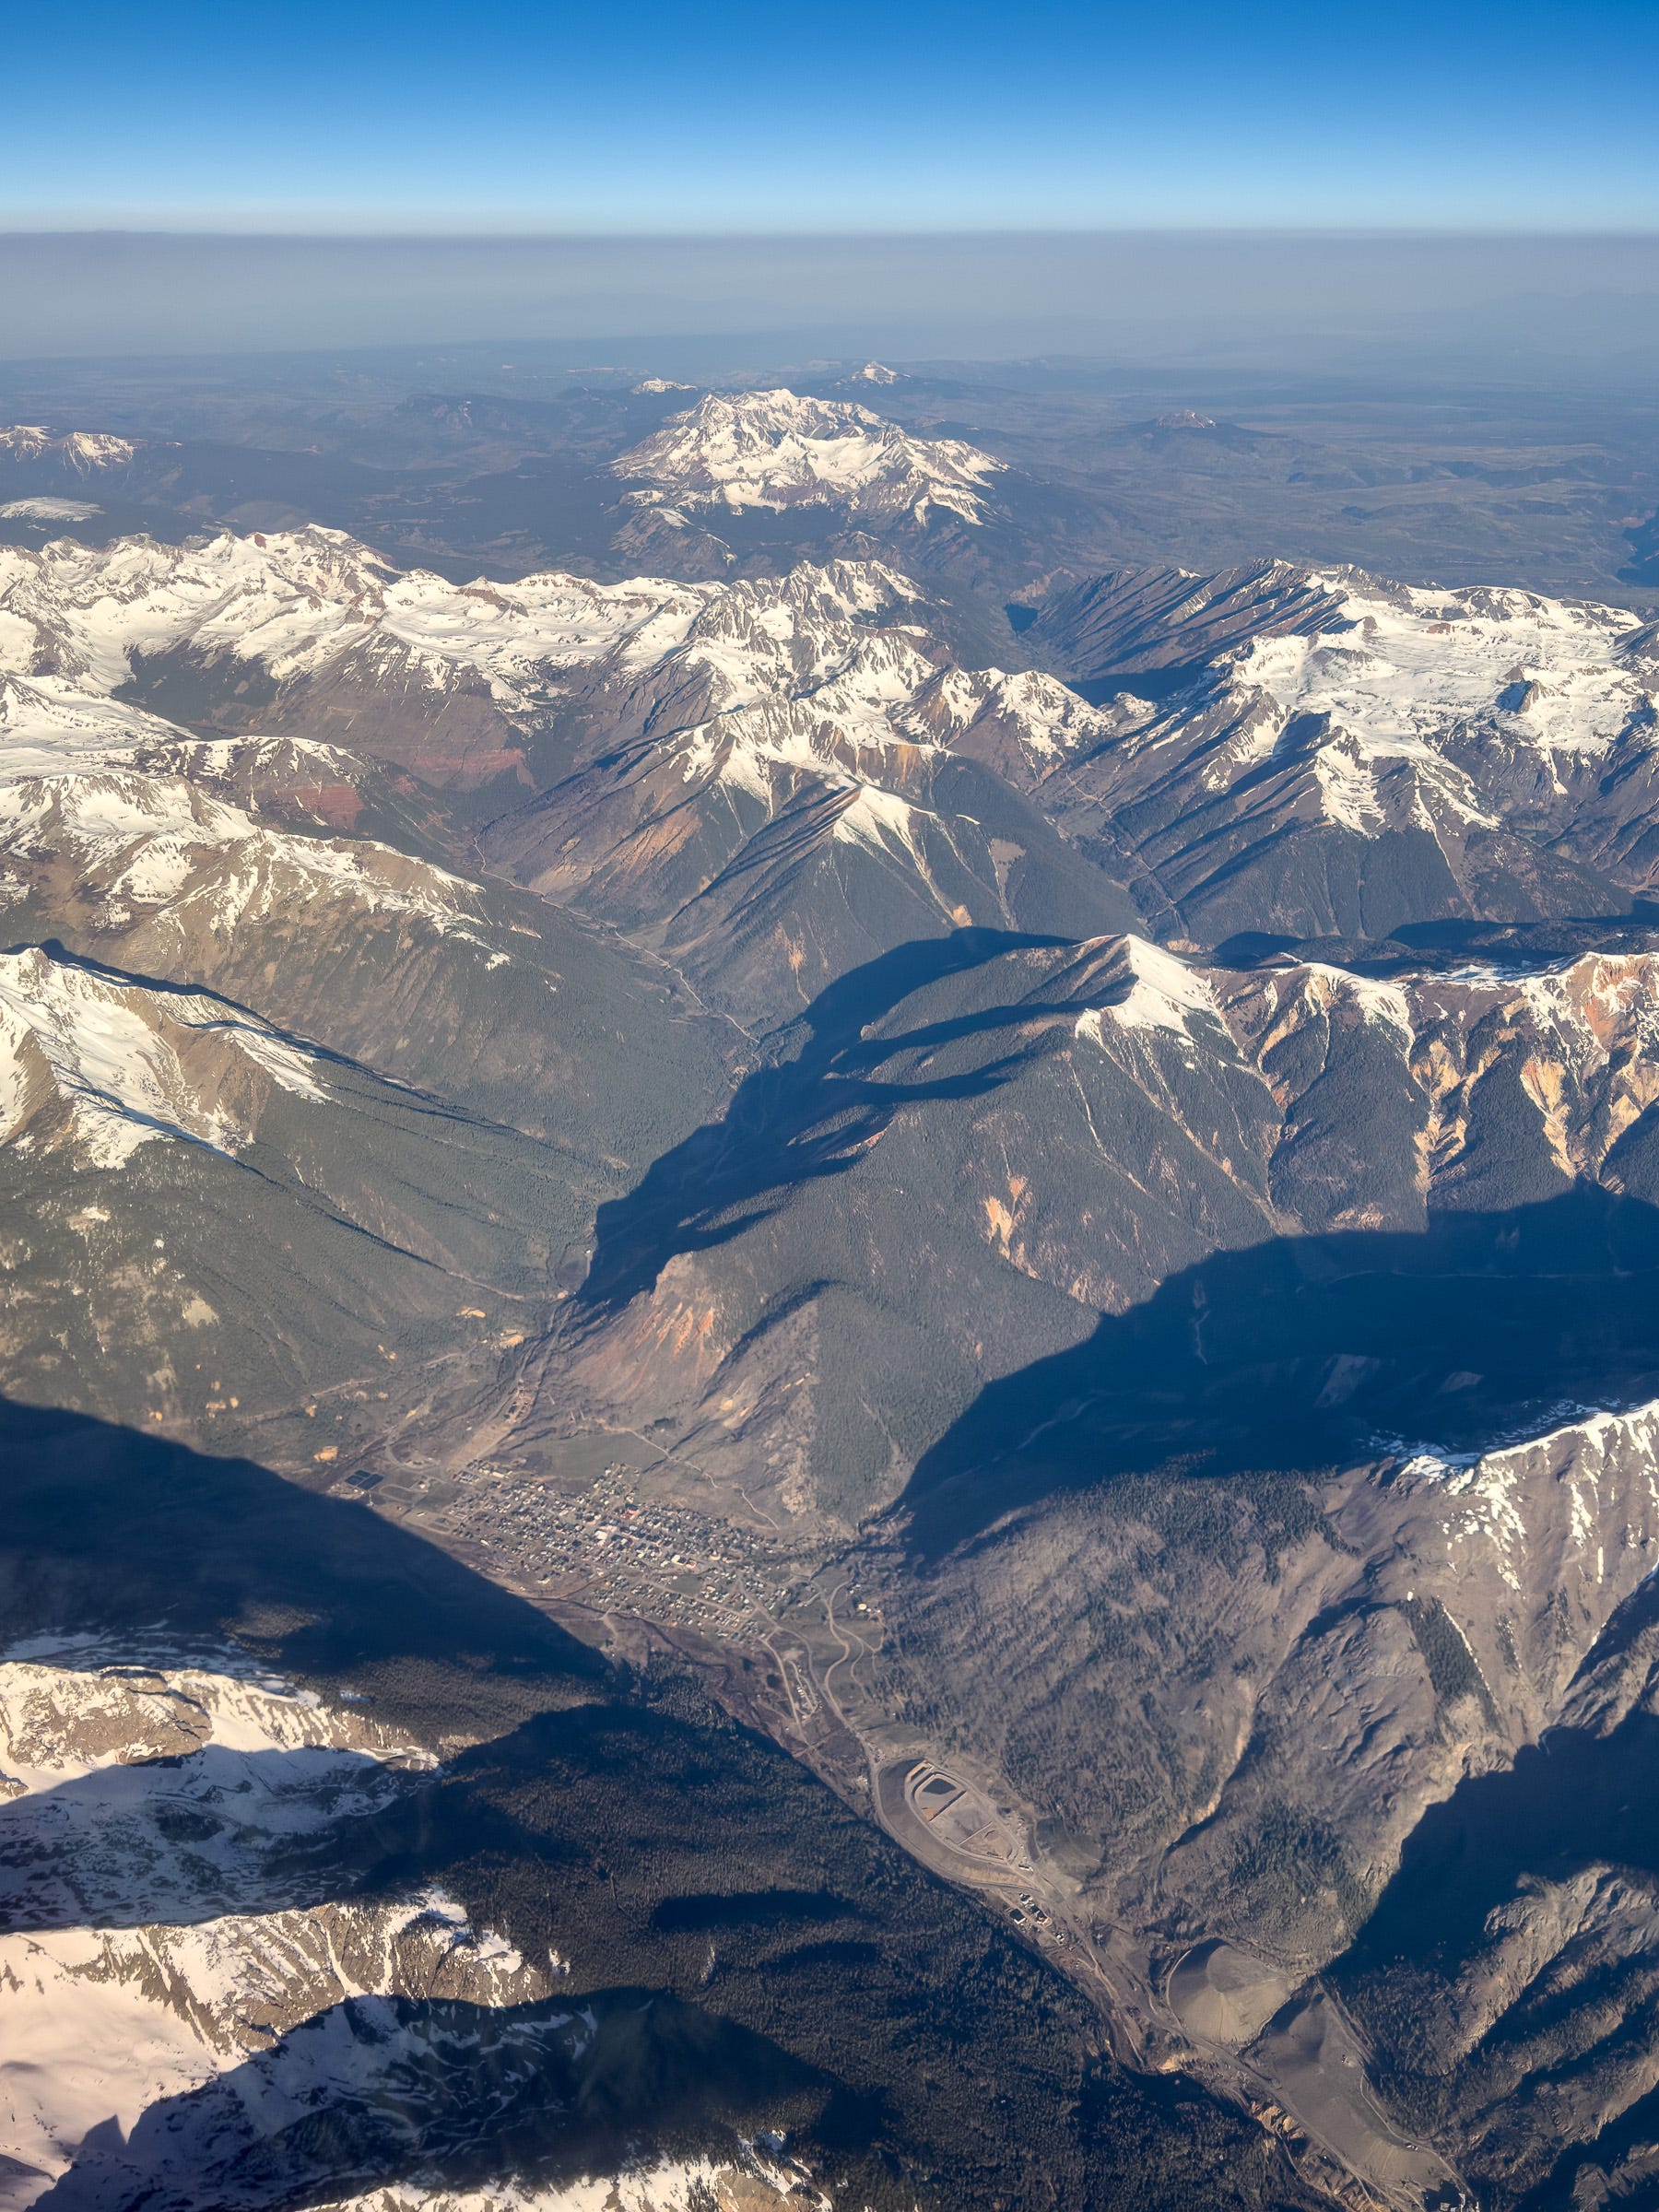
A little farther north, around Silverton, the snow had also retreated uphill.
Those are a few highlights from the San Juans. You can see more images from the rest of the flight over Colorado’s Rocky Mountains in this gallery on mitch.photos.
You're always getting a window seat!